


官方供應商
我們作為官方授權經銷商,直接提供超過200家開發廠家所發行超過1000個的產品授權給您。
請參閱我們所有的品牌。
Reporting themes refers to applying consistent visual styles such as colors, fonts, and layouts across report elements to match an application's design and branding. This ensures a cohesive user experience, simplifies development through centralized style management, and supports dynamic customization such as light or dark mode. Common use cases include branded dashboards, client-specific report styling, and consistent visuals in multi-tenant SaaS platforms.
Several ASP.NET Core reporting controls offer support for themes including:
For an in-depth analysis of features and price, visit our ASP.NET Core reporting controls comparison.
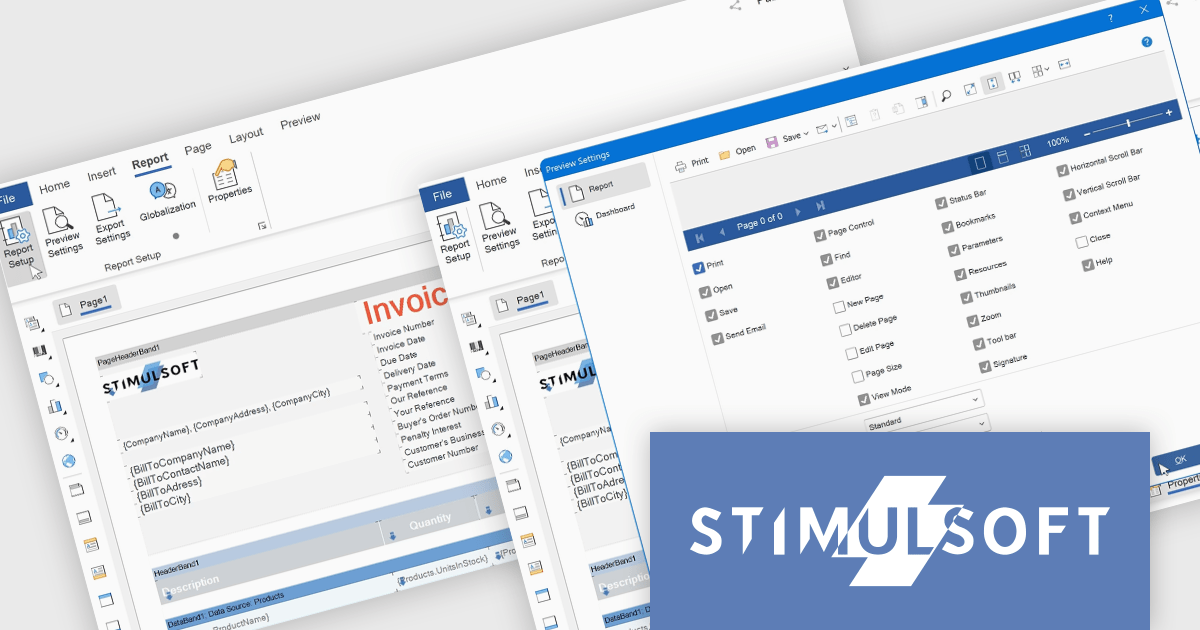
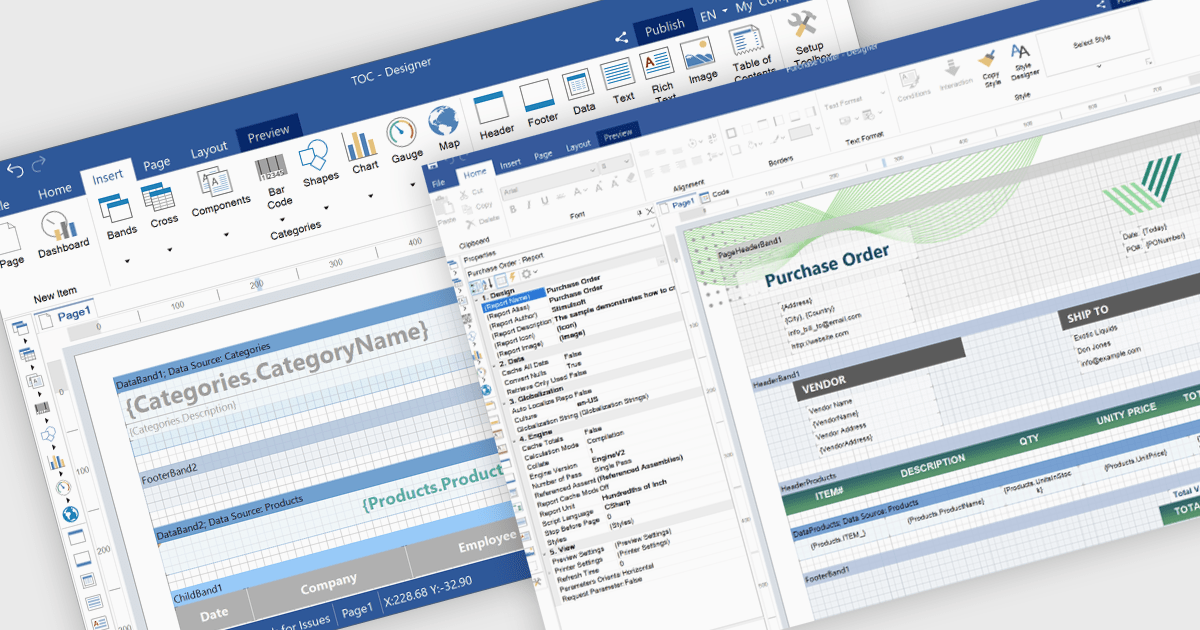
Stimulsoft Reports.WEB is a cross-platform reporting solution designed for integration within web applications. It leverages a client-server architecture for report generation, viewing, printing, and exporting directly in web browsers. Its powerful .NET report engine offers efficient report processing, a user-friendly HTML5 report designer for building reports with various data sources and visualizations, and an interactive HTML5 viewer for seamless report display within web applications. This integration allows developers to implement robust reporting functionalities without browser plugins or additional client-side dependencies.
The Stimulsoft Reports.WEB 2025.3.1 update introduces a new Report tab that improves the efficiency of report design by centralizing essential configuration tools within a single, accessible workspace. This tab integrates key functions such as Report Options, Preview Settings, Export Settings, and Globalization, allowing developers to manage the core aspects of their report templates without switching between multiple panels or views. By streamlining access to these commonly used features, the update enhances workflow speed, reduces setup complexity, and supports more consistent report output across different environments.
To see a full list of what's new in 2025.3.1, see our release notes.
Stimulsoft Reports.WEB is licensed per developer and is available as a perpetual license with 1 year support and maintenance. See our Stimulsoft Reports.WEB licensing page for full details.
Stimulsoft Reports.WEB is available individually or as part of Stimulsoft Ultimate.
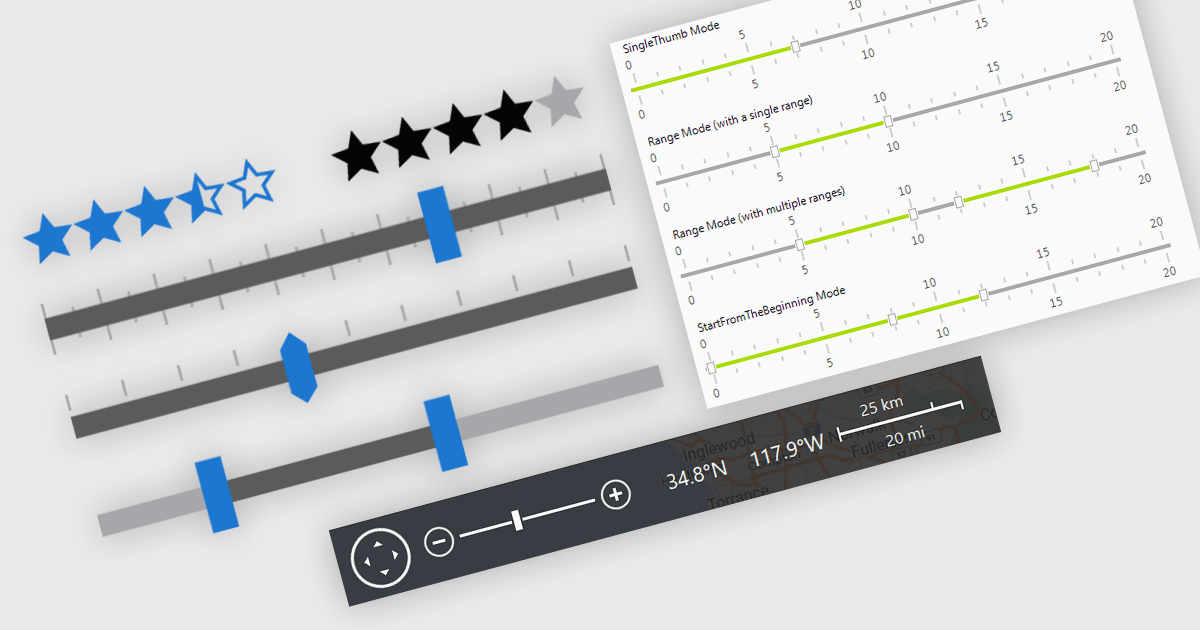
In .NET applications that require data editing, visual UI elements play a vital role in improving how users input and adjust data. For data entry such data visualization components as trackbars, range sliders, zoom controls, and rating elements offer an interactive alternative to text fields or dropdowns, making data input and feedback mechanisms more intuitive and precise. Whether it's setting numerical thresholds or filtering data sets based on user-defined limits, adjusting the view scale of charts, timelines, or graphical data displays, or quickly capturing feedback, these controls contribute to a more responsive and user-friendly interface. These components are especially valuable in scenarios that require fine-tuned input or subjective scoring, helping users make quick adjustments without disrupting the end-user's workflow.
Common features include:
For an in-depth analysis of features and price, visit our .NET data editors comparison.
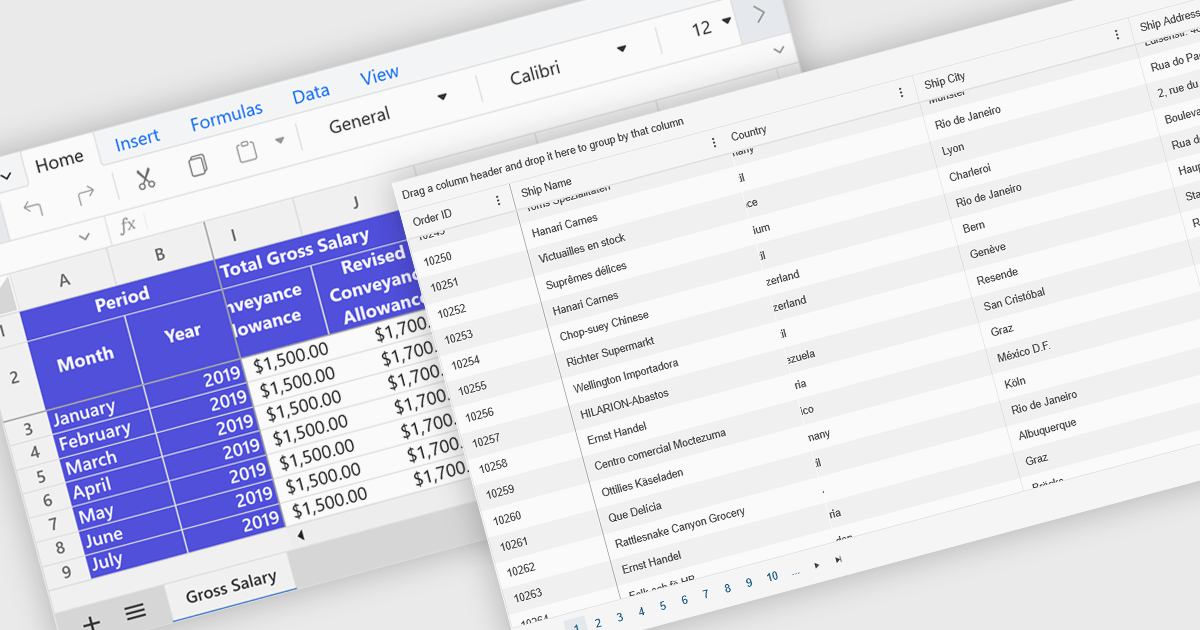
Freeze Panes in spreadsheets is a feature that keeps selected rows or columns visible while you scroll through your data. This helps maintain context in large spreadsheets by keeping headers or labels in view, making it easier to read, analyze, and enter information accurately. Common use cases include freezing the top row in a budget sheet to keep month names visible, or locking the first column to see item names while reviewing data across many columns. It is especially valuable in financial reports, sales tracking, and project management tools where clarity and precision are essential.
Several ASP.NET Core spreadsheet controls offer freeze pane support including:
For an in-depth analysis of features and price, visit our ASP.NET Core spreadsheet controls comparison.
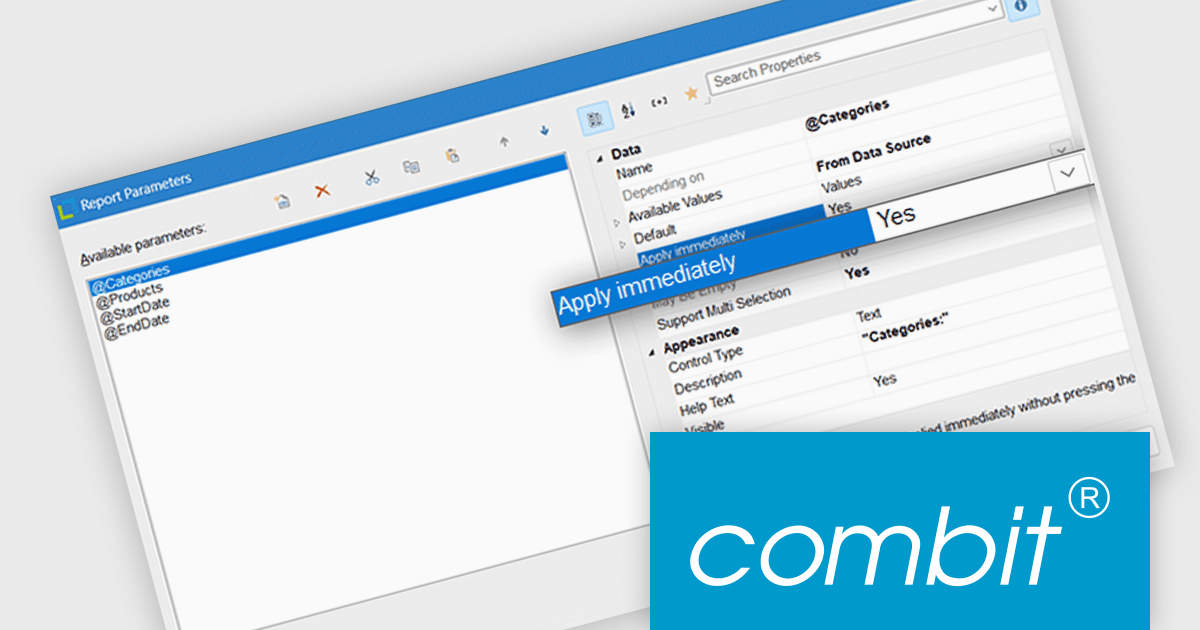
List & Label by combit is a software development toolkit that empowers developers to integrate comprehensive reporting functionalities into their desktop, web, and cloud applications. It offers features such as data binding, complex data visualization, and a user-friendly report designer, along with printing, exporting, and previewing capabilities. List & Label operates independently of programming languages and data sources, providing developers with the flexibility to design and deliver informative reports within their development environment.
List & Label now includes an "Apply immediately" property for report parameters, which when set, automatically re-renders the report immediately after the property in question is changed. This feature removes the need to manually refresh the report when updating the parameters, making it particularly useful in interactive reporting scenarios where users need to see updated results as they adjust filters or settings in real time.
List & Label is licensed per developer and is available as a Perpetual License with a 12 month support and maintenance subscription. See our List & Label licensing page for full details.
List & Label is available in the following products:
聯繫電話: (888) 850 9911
傳真: +1 770 250 6199


