


官方供應商
我們作為官方授權經銷商,直接提供超過200家開發廠家所發行超過1000個的產品授權給您。
請參閱我們所有的品牌。
KendoReact by Telerik is a comprehensive library of UI components specifically designed for building modern, feature-rich React applications, enabling developers to create intuitive, responsive, and visually appealing interfaces with ease. It includes robust components like data grids, charts, form elements, and navigation tools, optimized for high performance with features such as virtualization for large datasets and adherence to accessibility standards. Ideal for dashboards, enterprise apps, and data-driven applications, KendoReact empowers teams to accelerate development, ensure design consistency, and deliver inclusive user experiences.
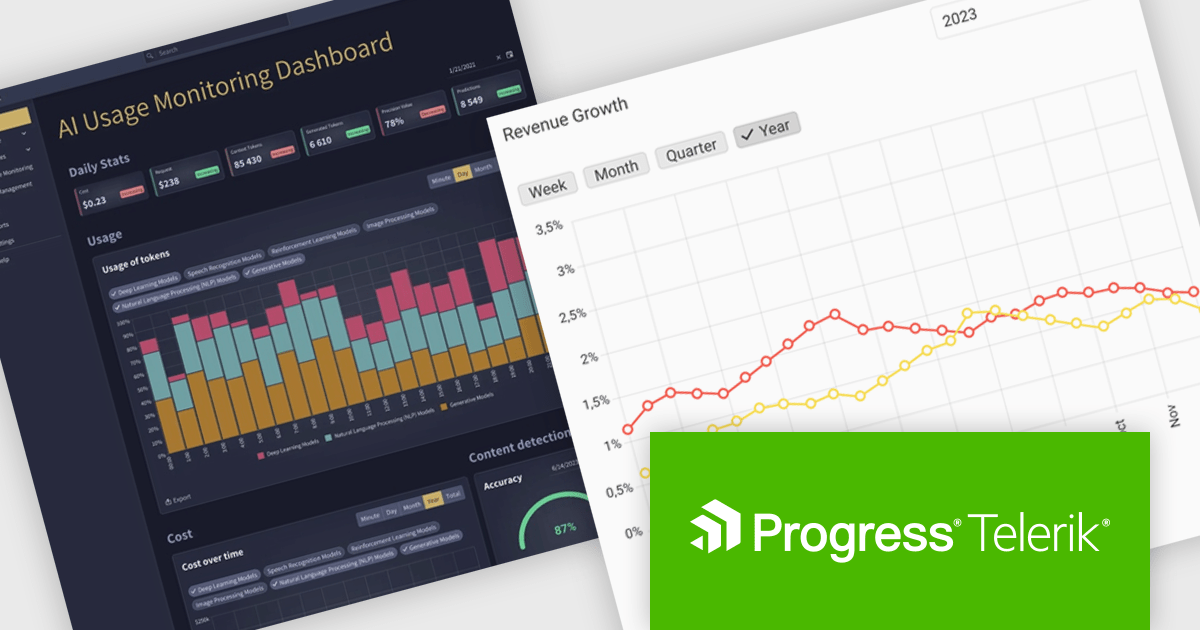
The KendoReact v9.4.0 update enhances UI development efficiency by introducing 12 new Building Blocks, including Dashboard Cards, an AI App Welcome Screen, an AI-powered Editor, and an AI Usage Monitoring Dashboard Template. These pre-configured components, seamlessly integrated with KendoReact, enable developers to accelerate application design, maintain consistency, and reduce implementation effort. By leveraging these ready-to-use elements, teams can focus on building functionality rather than UI assembly, ensuring faster delivery of modern, AI-driven applications with a polished user experience.
To see a full list of what’s new in 2025 Q1 (v9.4.0), see our release notes.
KendoReact is licensed per developer and has two licensing models: an annual Subscription License and a Perpetual License. The Subscription license provides access to the latest product updates, technical support, and exclusive benefits for a flat annual fee, and must be renewed to continue using the software. The Perpetual license is a one-time purchase granting access to the current released version and includes a one-year subscription for product updates and technical support. After this initial period, users can choose to renew the subscription element to continue receiving updates and support; otherwise, they may continue using the installed version available during their active subscription term but will forgo future updates and support. See our KendoReact licensing page for full details.
KendoReact is available individually or as part of the following products:
SurveyJS is a family of extensible JavaScript libraries designed to help developers build robust form management systems fully integrated into their web applications. These libraries work seamlessly with any backend system and are fully compatible with modern JavaScript frameworks, including React, Angular, and Vue 3.
SurveyJS Survey Creator is a powerful form-building UI component featuring an intuitive drag-and-drop interface that makes form creation accessible to all users. Its UI is fully customizable - from appearance and functionality to the UI language - allowing it to seamlessly blend into your application. Behind the scenes, SurveyJS leverages a JSON-based schema to define forms and surveys, making it easy to store, share, and dynamically render form structures across different environments.
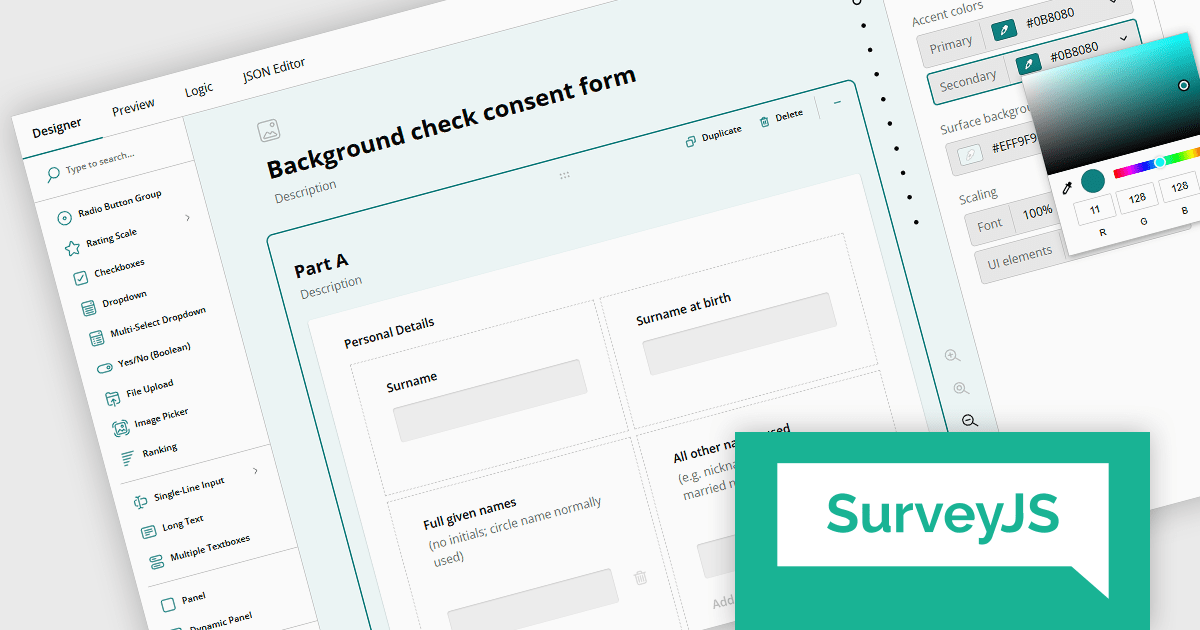
Users can enjoy an intuitive survey-building experience with extensive UI customization options, available through a dedicated UI settings panel. Introduced in version 2.0 the settings panel includes three new predefined UI themes - Light, Dark, and Contrast (with WCAG 2.2-compliant colors). These themes can be used as-is or further customized with options for UI and font scale size, accent colors, and background colors. Along with other enhancements these UI options create a more flexible environment where each user can personalize the form builder UI to align perfectly with their personal preferences.
SurveyJS Survey Creator is licensed per developer with a one-time payment for indefinite use. Access to updates and technical support is available through a subscription. See our SurveyJS Survey Creator licensing page for full details.
Learn more on our SurveyJS Survey Creator product page.
SurveyJS Survey Creator is a JavaScript library that enables developers to embed a drag-and-drop survey and form builder directly within their web applications. It provides a comprehensive UI for designing surveys with various question types, logic branching, and layout customization, generating JSON schemas that can be used by the SurveyJS Survey Library to render and process the surveys. This allows for the creation of dynamic and user-configurable data collection tools without requiring extensive custom development, streamlining the process of integrating survey functionality into applications.
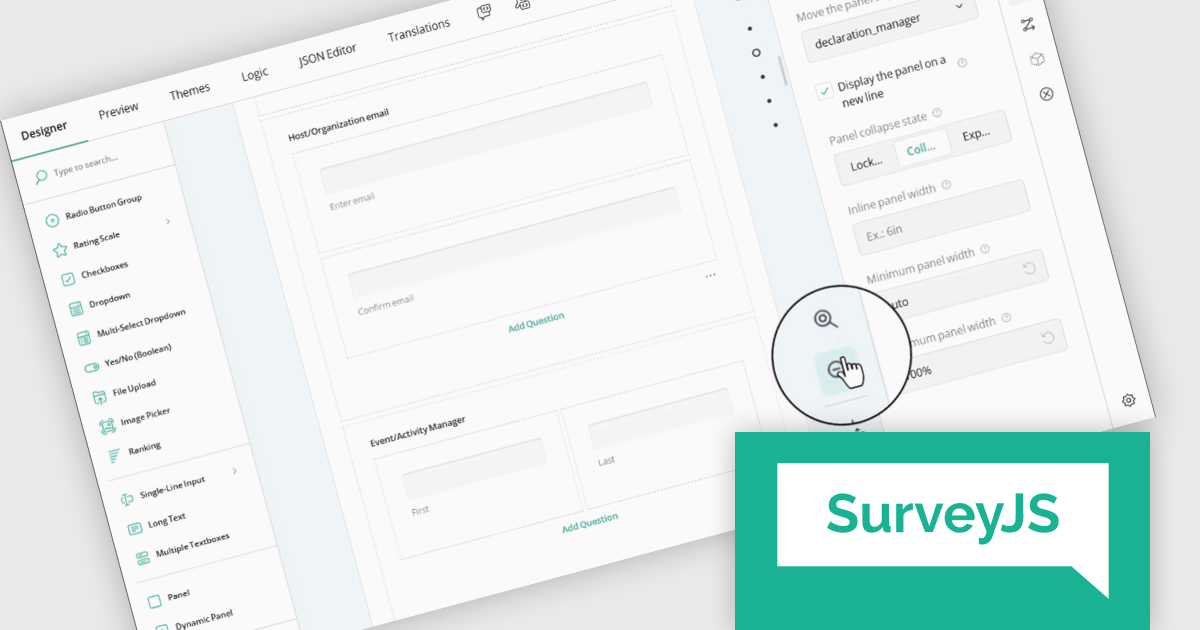
The SurveyJS Survey Creator 2.0.0 release adds support for scaling, enabling users to dynamically adjust the zoom level of the survey design surface. This functionality provides control over the visual representation of forms, allowing users to zoom in for detailed editing of intricate elements or zoom out for a comprehensive overview of complex, multi-page surveys. A dedicated "Zoom to 100%" button ensures a quick and effortless return to the default view.
To see a full list of what's new in version 2.0.0, see our release notes.
SurveyJS Survey Creator is licensed per developer with a one-time payment for indefinite use. Access to updates and technical support is available through a subscription. See our SurveyJS Survey Creator licensing page for full details.
Learn more on our SurveyJS Survey Creator product page.
ActiveReportsJS by MESCIUS is a JavaScript reporting toolkit that empowers developers to design and embed interactive reports within web applications. It offers a standalone report designer for crafting reports and a JavaScript report viewer component for seamless integration into web frameworks like React or vanilla JavaScript. This solution streamlines report creation, facilitates data visualization, and delivers a user-friendly report experience.
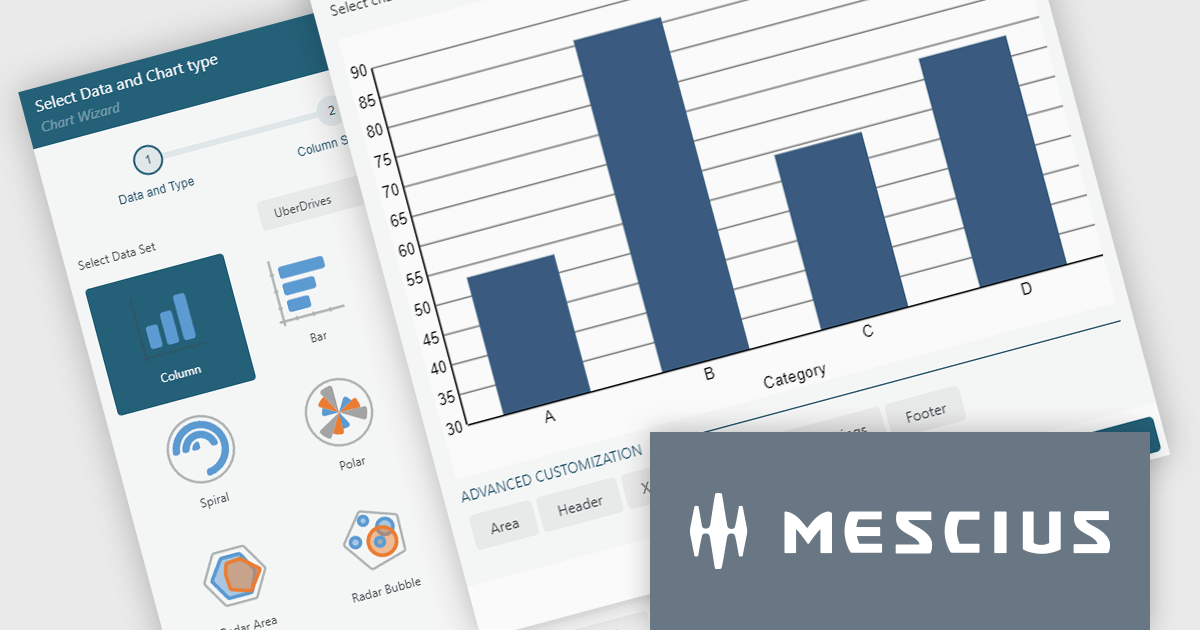
The ActiveReportsJS 5.2 update introduces a completely revised chart report item, offering greater flexibility and control over data visualization. With enhanced configurability, developers can now customize data binding, axis settings, labels, and legends using dynamic expressions, allowing for more precise and adaptable chart designs. Additionally, seamless migration ensures that existing charts are automatically converted to the new model when older reports are opened in the designer, eliminating the need for manual adjustments. These improvements simplify chart configuration and make it easier to create clear and insightful reports.
To see a full list of what's new in 5.2, see our release notes.
ActiveReportsJS is licensed on an annual subscription or perpetual basis and is available as a Single Deployment License for non-commercial use, and as a Single Domain License or Unlimited Domain License for commercial and/or SaaS use. See our ActiveReportsJS licensing page for full details.
Learn more on our ActiveReportsJS product page.
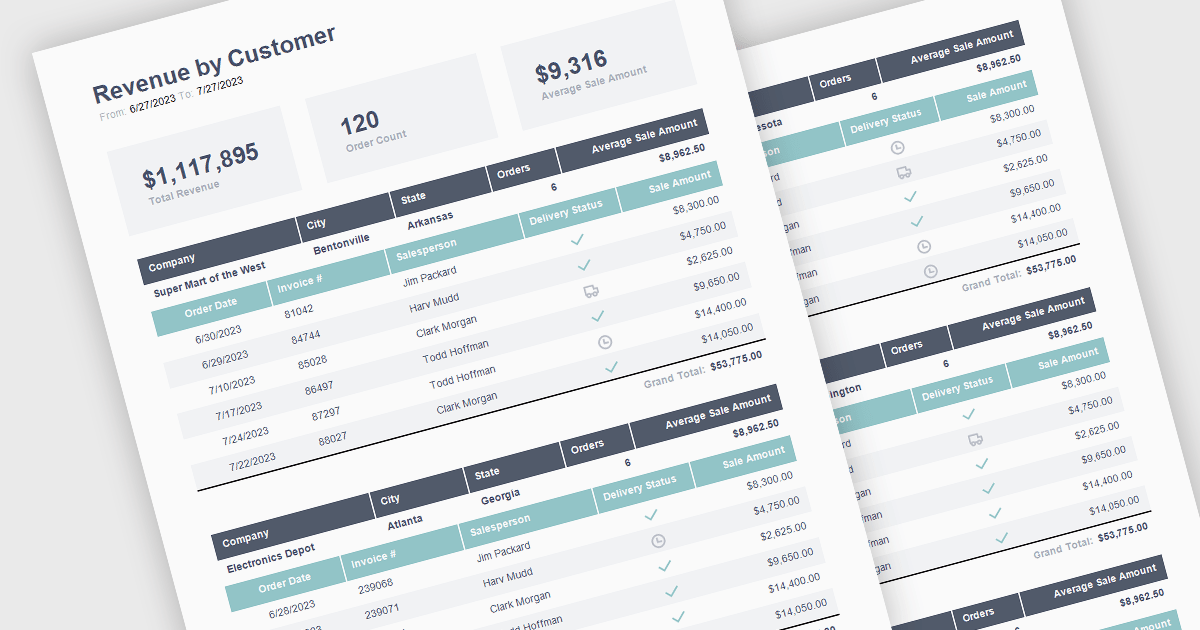
The ability to summarize and aggregate information in a report provides a means of condensing extensive data sets to form part of a concise and meaningful overview of the report's contents. This feature highlights key insights, eliminating the need for readers to sift through raw data. Aggregation processes the data mathematically through calculations such as totals, averages, percentages, means, or medians to identify patterns and trends. By highlighting and summarizing the report's findings in this way, this feature consolidates complex information in a way that aides the reader in identifying patterns and interpreting the data.
The following React reporting components support summaries and aggregates:
For an in-depth analysis of features and price, visit our comparison of React reporting components.
聯繫電話: (888) 850 9911
傳真: +1 770 250 6199


