


官方供應商
我們作為官方授權經銷商,直接提供超過200家開發廠家所發行超過1000個的產品授權給您。
請參閱我們所有的品牌。
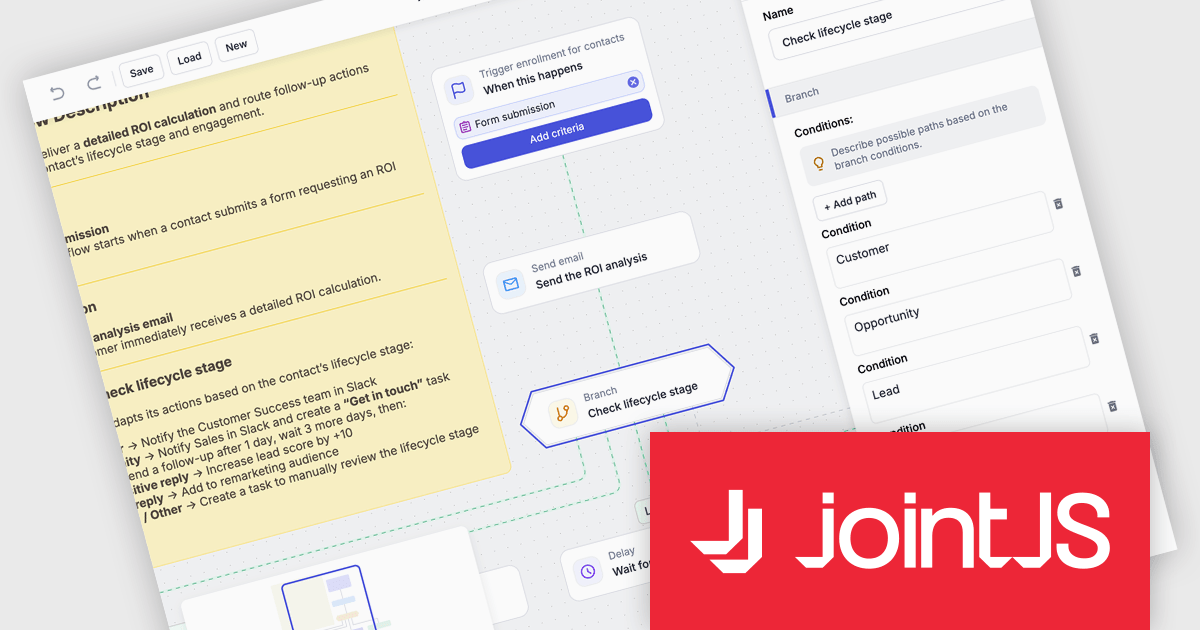
JointJS+ is a diagramming library that offers advanced features like custom shapes, data binding, and advanced layout algorithms, enabling you to create complex, interactive, and visually appealing diagrams. It includes a ready-to-use demo application that showcases its functionality and serves as a starting point for your own diagramming projects.
The JointJS+ v4.2.2 update introduces a new Marketing Automation application template that enables developers to efficiently design, visualize, and manage marketing automation workflows through an interactive, fully animated diagram with automatic layout and orthogonal link routing. By eliminating the need for manual positioning and providing smooth transitions between states, the template improves diagram clarity and maintainability while allowing developers to simulate workflows using the built-in test flow functionality to validate logic, identify issues early, and iterate with greater confidence.
To see a full list of what's new in v4.2.2, see our release notes.
JointJS+ is licensed per developer and is available as a Perpetual license with 1 year support and maintenance. See our JointJS+ licensing page for full details.
Learn more on our JointJS+ product page.
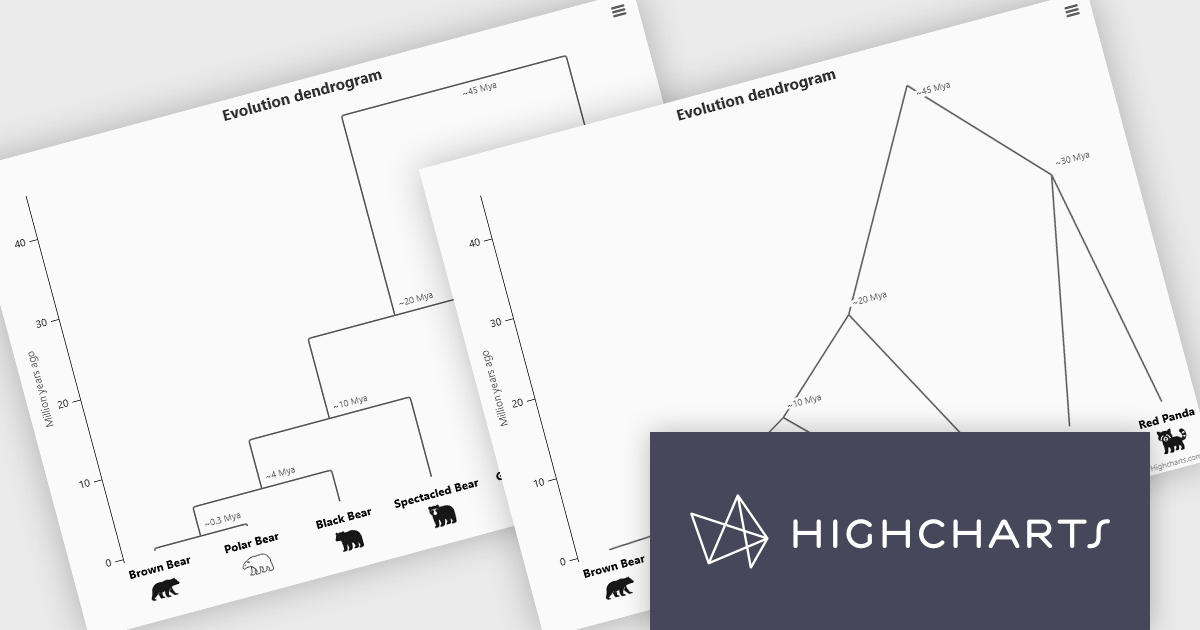
Highcharts is a JavaScript charting framework that allows web developers and data analysts to generate dynamic, visually appealing charts and graphs for websites and web applications. It can display a variety of chart types, including line, spline, area, column, bar, pie, scatter, and many more. Highcharts is well-known for its ease of use, rich documentation, and ability to handle huge datasets efficiently. Features include responsive design, accessibility support, and cross-browser compatibility. Its customization capabilities allow users to create bespoke data visualizations that increase engagement and provide insightful data presentations.
The Highcharts 12.5 update introduces dendrogram support, allowing developers to visualize hierarchical relationships and similarity levels directly within their charts using treegraph-based diagrams. This enhancement makes it easier to represent the output of hierarchical clustering algorithms, taxonomies, and other structured datasets in a clear and interpretable way. By mapping similarity or progression along an axis and using branch height to indicate relationships, developers can present complex hierarchical data more effectively.
To see a full list of what's new in 12.5, see our release notes.
Highcharts Core is licensed on an annual or perpetual basis, OEM licenses, and Advantage Renewals. It is licensed per Developer and has several license options including Internal, SaaS, SaaS+, and Self Hosted. See our Highcharts Core licensing page for full details.
Learn more on our Highcharts Core product page.

Froala Editor is a lightweight, modern WYSIWYG (What You See Is What You Get) rich text editor designed for web applications, offering a clean interface, fast performance, and extensive customization options. Built with a focus on usability and developer flexibility, it provides a wide range of formatting tools, media management capabilities, and advanced features such as inline editing, collaborative functionality, and mobile responsiveness. Its modular architecture, robust API, and broad framework integrations make it suitable for embedding into enterprise-level platforms as well as smaller applications requiring a polished content-editing experience.
The Froala v5.0.0 update introduces support for importing content directly from Microsoft Word documents. This allows users to bring in Word-authored content while keeping the original formatting, styles, and structure intact. The update removes the need for custom cleanup scripts, helping produce more reliable and consistent HTML during content transfers.
To see a full list of what's new in v5.0.0, see our release notes.
Froala Editor is licensed per product and domain. It is available as an annual or perpetual license with version upgrades and support. See our Froala Editor licensing page for full details.
For more information, visit our Froala Editor product page.
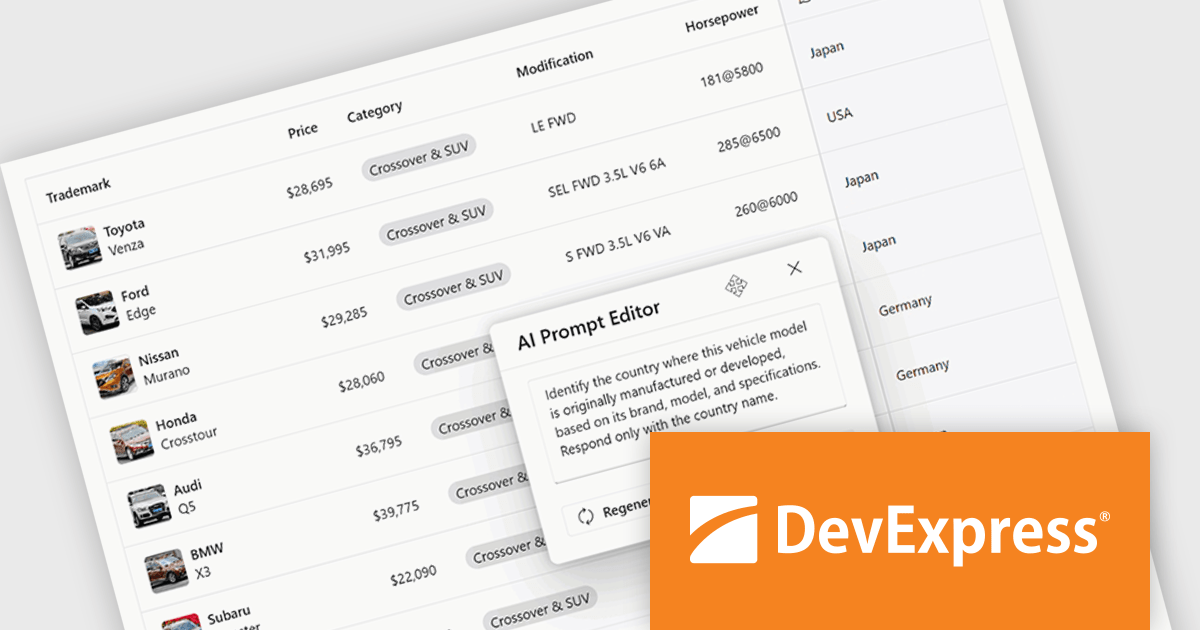
DevExtreme Complete is a robust suite of tools by DevExpress designed to streamline the development of high-performance web applications. It includes a wide range of UI components for modern frameworks such as Angular, React, Vue, and jQuery, making it ideal for developers aiming to create responsive, cross-platform applications with ease. With features like rich data visualization, interactive grids, form controls, and adaptive layouts, it empowers developers to deliver polished and user-friendly interfaces. Whether you're building enterprise dashboards or consumer-facing apps, DevExtreme Complete provides the flexibility and power to meet complex requirements while maintaining performance and usability.
The DevExtreme Complete 25.2 release brings AI Columns to its DataGrid and TreeList components, allowing developers to infuse artificial intelligence directly into their data presentation layers. AI Columns use component data and custom prompts to generate contextually relevant values - automating tasks like categorization, summarization, translation, and recommendation. Whether grouping records by priority, detecting sentiment, or transforming addresses, this feature opens up new ways to interact with and analyze structured data, making these components powerful tools for AI-assisted data exploration.
To see a full list of what's new in version 25.2, see our release notes.
DevExtreme Complete is licensed per developer and is available as a Perpetual License with a 12 month support and maintenance subscription. See our DevExtreme Complete licensing page for full details.
DevExtreme Complete is available to buy individually or as part of the following products:
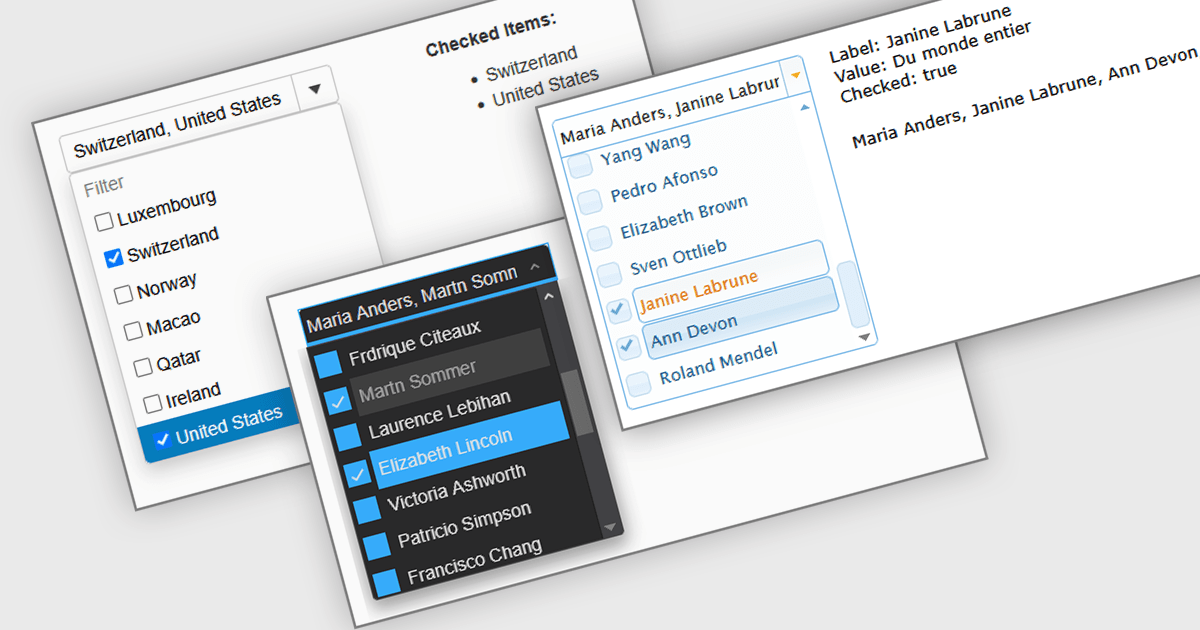
A Checked Combobox in a JavaScript Data Editor is a user interface component that allows users to select multiple options from a dropdown list using checkboxes. It combines the compact form of a combobox with the functionality of a multi-select control, helping to conserve screen space while enabling clear, granular input. This component simplifies data entry and editing workflows, particularly when working with datasets that require multiple discrete values to be associated with a single field. For developers, it offers a way to manage complex form inputs more efficiently, improving both usability and data integrity in cross-platform data management applications.
Several JavaScript data editors offer checked combobox functionality including:
For an in-depth analysis of features and price, visit our comparison of JavaScript data editors.
聯繫電話: (888) 850 9911
傳真: +1 770 250 6199


