


官方供應商
我們作為官方授權經銷商,直接提供超過200家開發廠家所發行超過1000個的產品授權給您。
請參閱我們所有的品牌。
ComponentSource and Change Vision have enjoyed a successful partnership since 2005, working together to bring high-quality software modeling and visualization tools to developers around the world. This collaboration centers around a shared commitment to improving software design processes through intuitive, visual communication. With a focus on usability, clarity, and collaboration, Change Vision’s tools enable teams to model complex systems effectively and stay aligned throughout the development lifecycle.
Change Vision is a software company known for developing tools that support software modeling and agile project management. It is best recognized for Astah Professional, a suite of lightweight and user-friendly modeling tools that support Unified Modeling Language (UML), Entity-Relationship Diagrams (ERD), flowcharts, and other visual representations essential for software design and architecture. With a strong emphasis on usability and team collaboration, Change Vision has built a reputation for helping developers and architects clarify complex systems and communicate design intent effectively. Its long-standing partnership with ComponentSource reflects its sustained global presence and commitment to delivering accessible modeling solutions to development teams worldwide.
ComponentSource’s collaboration with Change Vision brings significant benefits to global development teams by providing streamlined access to the Astah suite of modeling tools through a trusted, enterprise-ready platform. This partnership enhances product visibility and global reach for Change Vision, while offering customers simplified licensing, flexible procurement options, localized currency support, and reliable customer service. By combining Change Vision’s intuitive, high-quality modeling solutions with ComponentSource’s global distribution network and expert sales support, the collaboration ensures that teams worldwide can efficiently adopt and manage the tools they need to design, document, and communicate complex software systems.
Learn more about Change Vision.
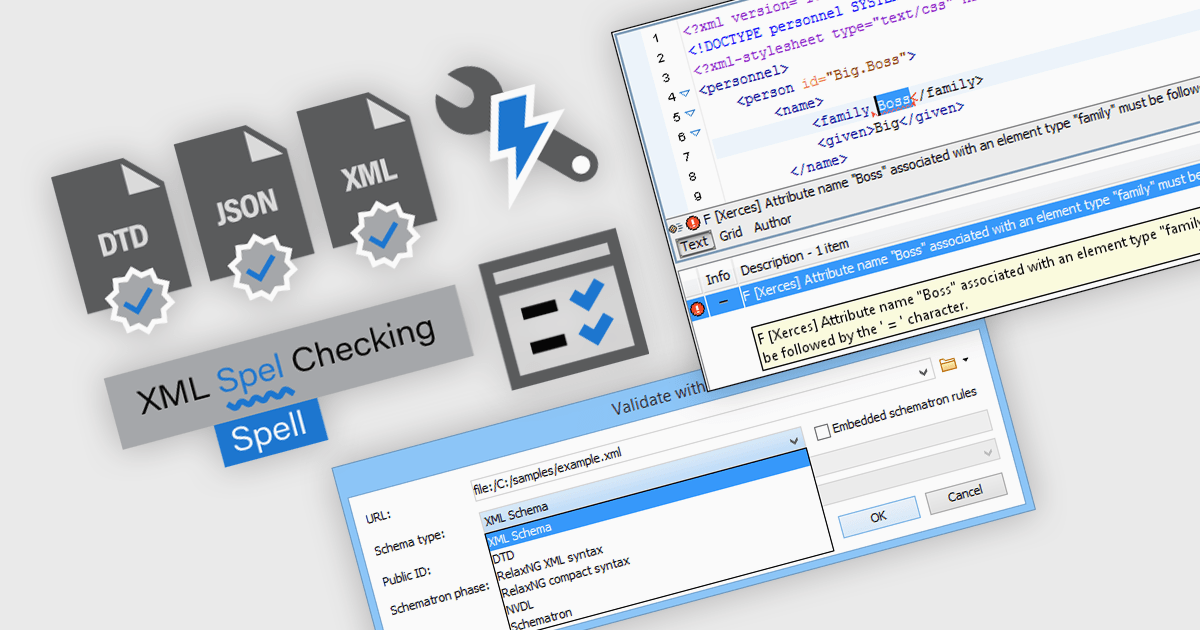
Validation and checking features in structured document tools are designed to ensure the integrity, correctness, and compliance of documents written in formats like XML and JSON. These tools assist developers and content authors throughout the editing process, detecting syntax errors, enforcing structural rules, and maintaining standards conformance. By integrating automated validation, intelligent correction suggestions, and format-specific diagnostics, these features reduce manual debugging effort and enhance the reliability of structured content in technical and data-driven applications.
Common features include:
For an in-depth analysis of features and price, visit our structured document tools comparison.
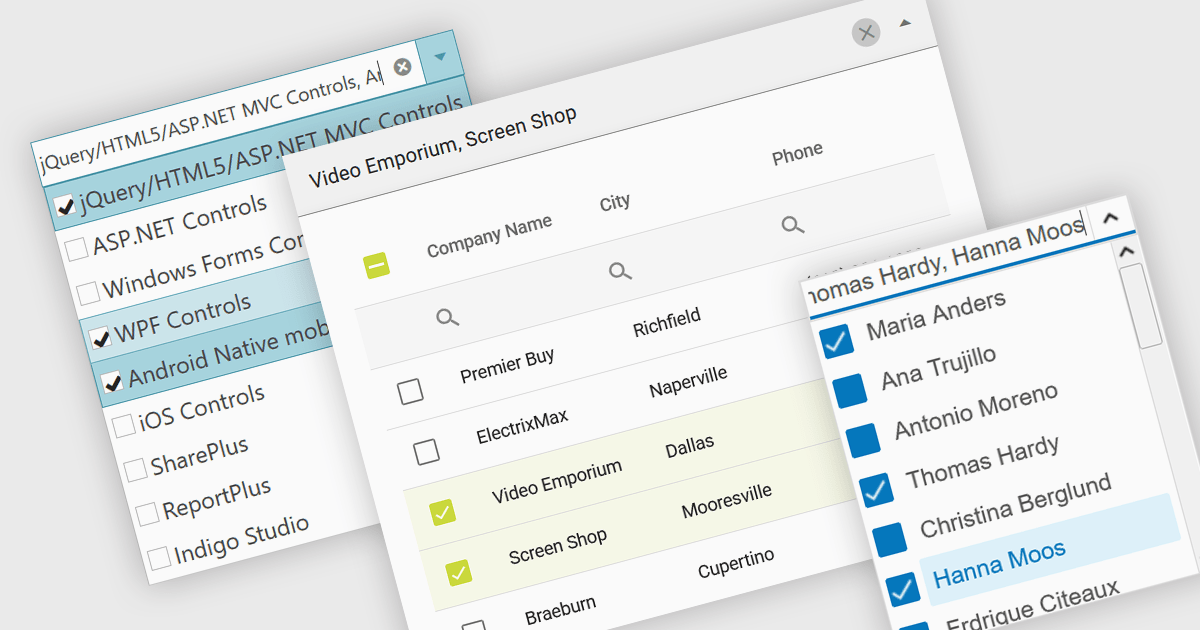
A checked combobox is a data editor component used in user interfaces that consists of a text box with a drop-down panel. This panel displays a predefined list of items, in a clean and organized layout, from which users can input data by making a singular or multiple selections using the adjacent checkboxes. The values are then typically displayed as a comma-separated summary in the collapsed field. This type of control provides developers with a convenient way to implement multi-select functionality within their applications, and is especially effective in scenarios such as filtering datasets or configuring settings, without consuming additional space on the interface.
Several jQuery data editor collections include checked comboboxes, including:
For an in-depth analysis of features and price, visit our comparison of jQuery data editors.
Axosoft is a trusted provider of agile project management software that helps teams ship software on schedule and with confidence. With powerful features like the Release Planner, burndown charts, and Standup Mode, Axosoft makes it easy to visualize workflows, track team progress, and predict release dates. Supporting Scrum, Kanban, or fully customized agile methodologies, Axosoft combines dashboards, configurable notifications, and wiki pages to keep teams aligned and informed throughout the development lifecycle.
Over the past decade, ComponentSource and Axosoft have built a strong, trusted relationship rooted in a shared goal: supporting developers. By offering Axosoft’s tools through its global distribution platform, ComponentSource has enabled customers around the world to access reliable agile project management solutions. This partnership has not only broadened Axosoft’s reach but has also ensured that developers benefit from simplified licensing, dedicated support, and easy access to best-in-class agile tools.
The 10-year partnership between ComponentSource and Axosoft has brought clear value to the developer community: better project visibility, improved collaboration, and predictable, on-time releases. As this milestone is celebrated, ComponentSource looks forward to building on shared success, continuing to provide innovative solutions that help software teams deliver their very best.
Learn more about Axosoft.
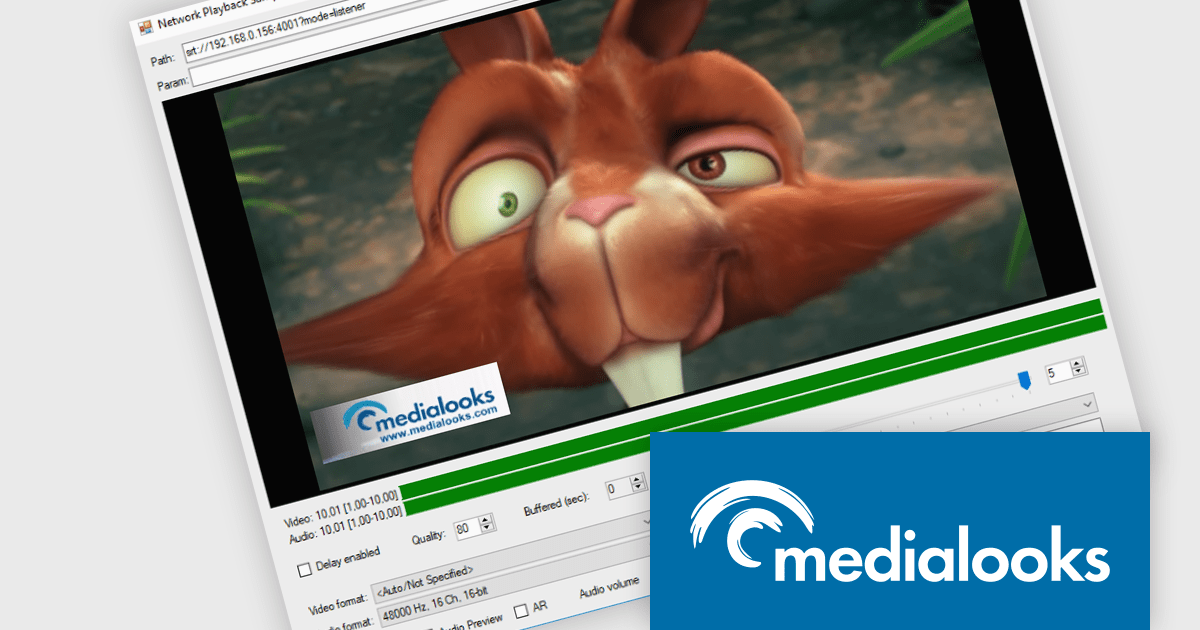
MPlatform SDK by Medialooks is a Windows-based software development kit designed for building real-time video applications with professional-grade capabilities. It provides a modular architecture that supports live video ingest, playout, processing, mixing, and streaming, all within a single framework. The SDK handles a wide range of formats and devices, including SDI, NDI, RTMP, and SRT, making it suitable for broadcast automation, live production, and surveillance solutions. With native support for GPU acceleration, timecode handling, and seamless integration into C++, C#, and .NET environments, MPlatform SDK enables developers to create complex video workflows with reduced development overhead.
The MPlatform SDK v2.10 update adds support for WebRTC 2.0, enabling developers to leverage a modern, more efficient real-time communication layer with backward compatibility to existing API code. It integrates a new signaling infrastructure—including a Docker-based server and web client optimized for platforms like iOS and macOS—and updates the WebRTC core to the latest version, improving connection stability, reducing reliance on TURN servers, and unlocking features such as multi‑peer mixing, mix‑minus configurations, and duplex video/audio streams. This results in more robust browser-native and native app integrations with minimal integration effort and enhanced flexibility.
MPlatform SDK is licensed per developer and is available as a perpetual license with 1 year support and maintenance. See our MPlatform SDK licensing page for full details.
Learn more on our MPlatform SDK product page.
聯繫電話: (888) 850 9911
傳真: +1 770 250 6199


