


官方供應商
我們作為官方授權經銷商,直接提供超過200家開發廠家所發行超過1000個的產品授權給您。
請參閱我們所有的品牌。
Stimulsoft Reports.JS provides a robust reporting toolkit designed specifically for JavaScript applications. This library leverages a client-side architecture, offering a pure JavaScript report engine for efficient report rendering directly within web browsers. The solution includes a user-friendly report designer for building reports with various data sources and visualizations, along with a report viewer for seamless integration and display within your JavaScript applications. This eliminates the need for server-side dependencies or browser plugins, simplifying the development process for embedding powerful reporting functionalities into your web projects.
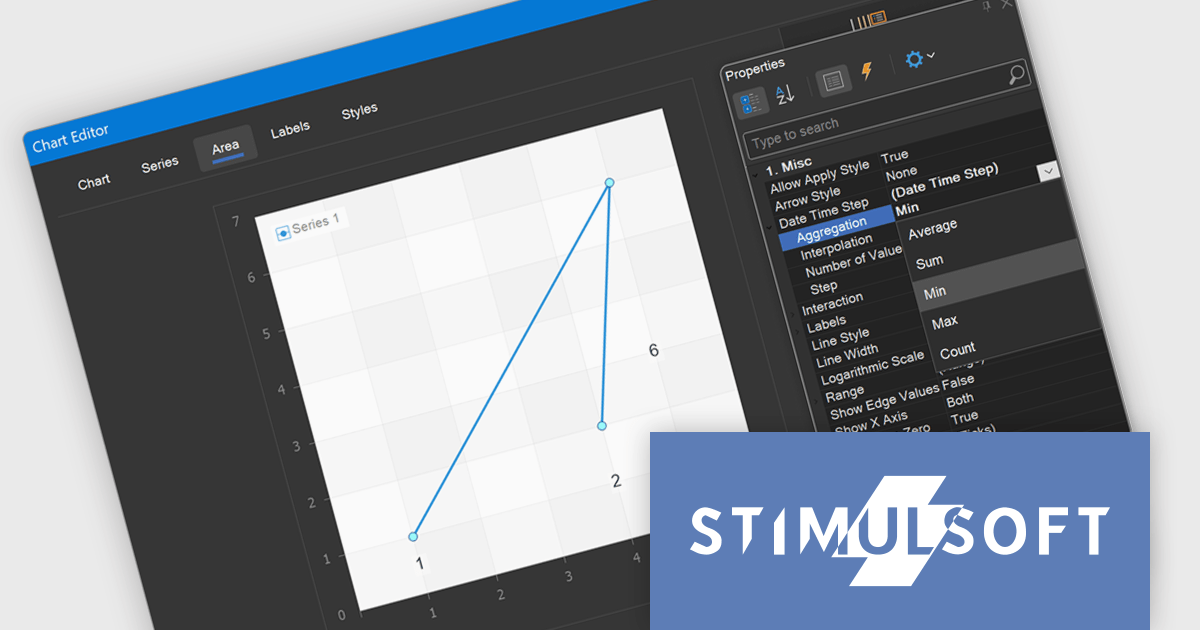
Stimulsoft Reports.JS now supports aggregation for Date Time Step, allowing developers to select from multiple data aggregation functions including Average, Sum, Min, Max, and Count. This enhancement provides greater control over how time-based data is grouped and displayed in report charts, enabling more accurate and relevant visualizations based on the specific nature of the dataset. By choosing the appropriate aggregation method, developers can optimize performance reporting, reveal insights more effectively, and better align visual outputs with analytical requirements.
Stimulsoft Reports.JS is licensed per developer and is available as a Perpetual license with 1 year support and maintenance. See our Stimulsoft Reports.JS licensing page for full details.
Stimulsoft Reports.JS is available individually or as part of Stimulsoft Ultimate.
Aspose.PDF for Go via C++, PHP via Java, and Rust via C++ are cross-platform PDF processing libraries that bring the rich functionality of the core Aspose.PDF engine to Go, PHP, and Rust environments. Each version is a language-specific wrapper around the mature C++ or Java backend, enabling developers to generate, read, modify, secure, and convert PDF documents within their native ecosystems. For example, the Go library uses cgo to expose document creation, text extraction, page manipulation, and format conversion. The PHP version leverages a Java bridge, providing access to features like text and image insertion, bookmark and annotation management, encryption, and XML‑templated PDF generation. Meanwhile, the Rust offering wraps the C++ core to offer safe, idiomatic Rust APIs for document optimization, page operations, and exporting to multiple output formats, with strong guarantees around memory safety and performance.
These libraries enable developers to easily integrate PDF capabilities into backend systems, web services, reporting tools, and document pipelines without relying on external PDF software. Each supports both simple use cases, like extracting text, creating "Hello World" PDFs, or splitting and merging files, and advanced workflows, including PDF repair, image compression, and content optimization. They also accommodate format conversions across office documents and image formats, facilitating data exchange between systems and document archival processes.
Aspose products are offered as Developer Small Business, Developer OEM, Developer SDK, Site Small Business, Site OEM and Site SDK licenses catering to a range of business needs. Licenses are perpetual, and include 1 year of support and maintenance. Subscription renewals are also available. For full details, see our licensing pages for Go via C++, PHP via Java, and Rust via C++.
These new products are available individually or as part of Aspose.Total Product Family.
Syncfusion Essential Studio for Xamarin by Syncfusion is a robust UI control suite for building cross-platform line of business applications targeting iOS, Android, UWP, WPF, and macOS from a single C# codebase. It offers over 155 controls including DataGrid, Charts, and ListView, enabling developers to create responsive enterprise-grade apps with a consistent user experience. Designed for performance and scalability, it supports MVVM architecture, touch interaction, and rapid development, making it ideal for data-centric applications in industries such as finance, healthcare, and logistics.
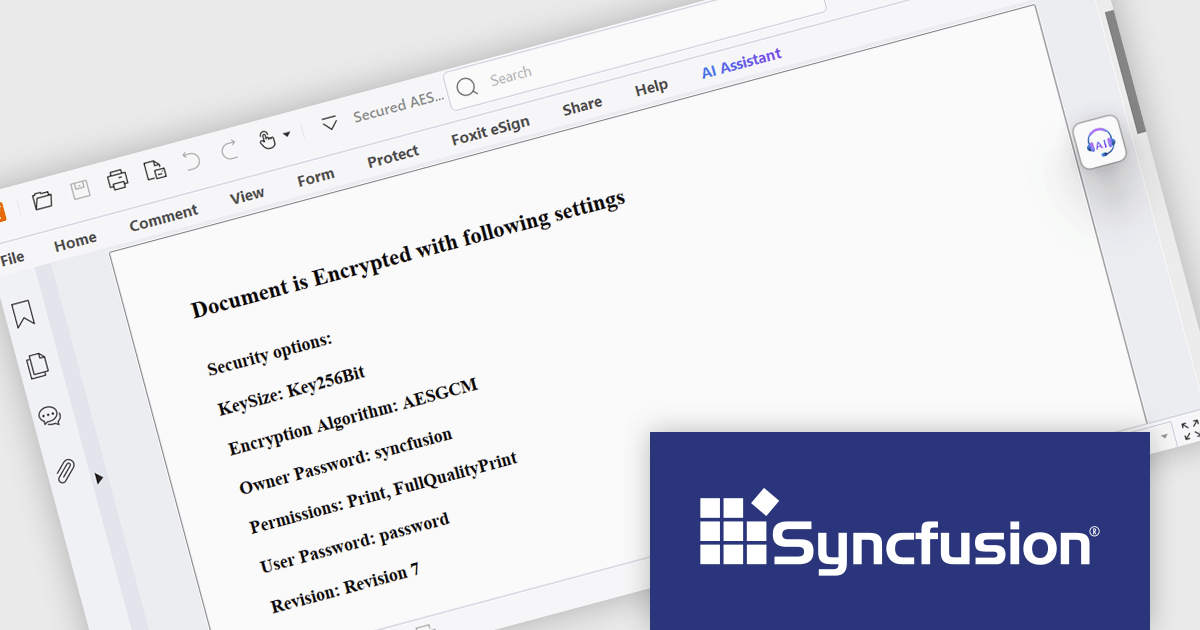
The Syncfusion Essential Studio for Xamarin offers advanced AES GCM encryption for PDFs, enabling developers to implement secure document workflows with confidence. This enhancement allows for robust encryption and decryption of PDF files using a modern cryptographic standard that provides both data confidentiality and integrity. By incorporating authenticated encryption, AES GCM ensures that PDF content is protected against unauthorized access and tampering, making it well-suited for applications that handle sensitive information or require compliance with stringent data protection standards.
Syncfusion Essential Studio for Xamarin is available as part of Syncfusion Essential Studio Enterprise which is licensed per developer starting with a Team License of up to five developers. It is available as a 12 Month Timed Subscription License which includes support and maintenance. See our Syncfusion Essential Studio Enterprise licensing page for full details.
Learn more on our Syncfusion Essential Studio for Xamarin product page.
Stimulsoft Dashboards.WEB is a versatile suite of tools for crafting interactive data visualizations for web and desktop applications. It empowers developers to embed intuitive dashboards across various platforms, using the platform-specific components or a centralized cloud designer. With rich data analysis elements, extensive customization options, and pre-built templates, Stimulsoft Dashboards helps you transform complex data into clear, actionable insights for any audience.
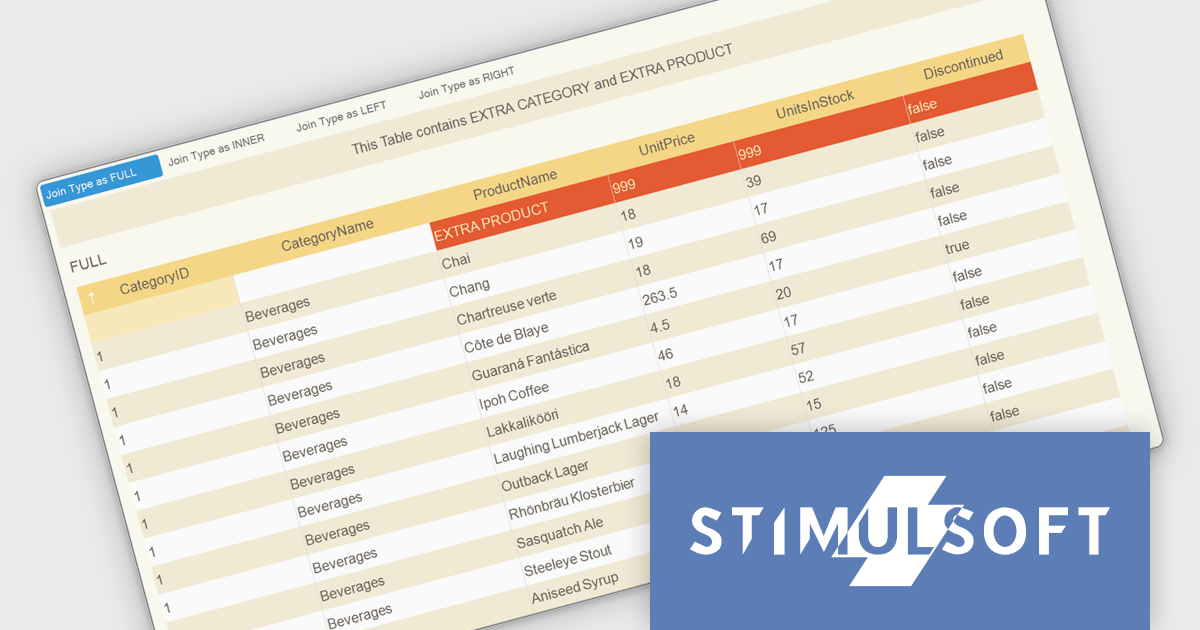
The Stimulsoft Dashboards.WEB 2025.3.1 update introduces support for selecting data join types including Full, Inner, Left and Right when combining tables during dashboard rendering and data transformation. This enhancement gives developers precise control over how datasets are merged, ensuring the resulting structure accurately reflects the intended relationships between records. By configuring join types directly in the relationship editor, developers can optimize data grouping, maintain consistency across transformations and visualizations, and produce more reliable and context-aware analytics.
To see a full list of what's new in 2025.3.1, see our release notes.
Stimulsoft Dashboards.WEB is licensed per developer and is available as a perpetual license with 1 year support and maintenance. See our Stimulsoft Dashboards.WEB licensing page for full details.
Stimulsoft Dashboards.WEB is available individually or as part of Stimulsoft Ultimate.
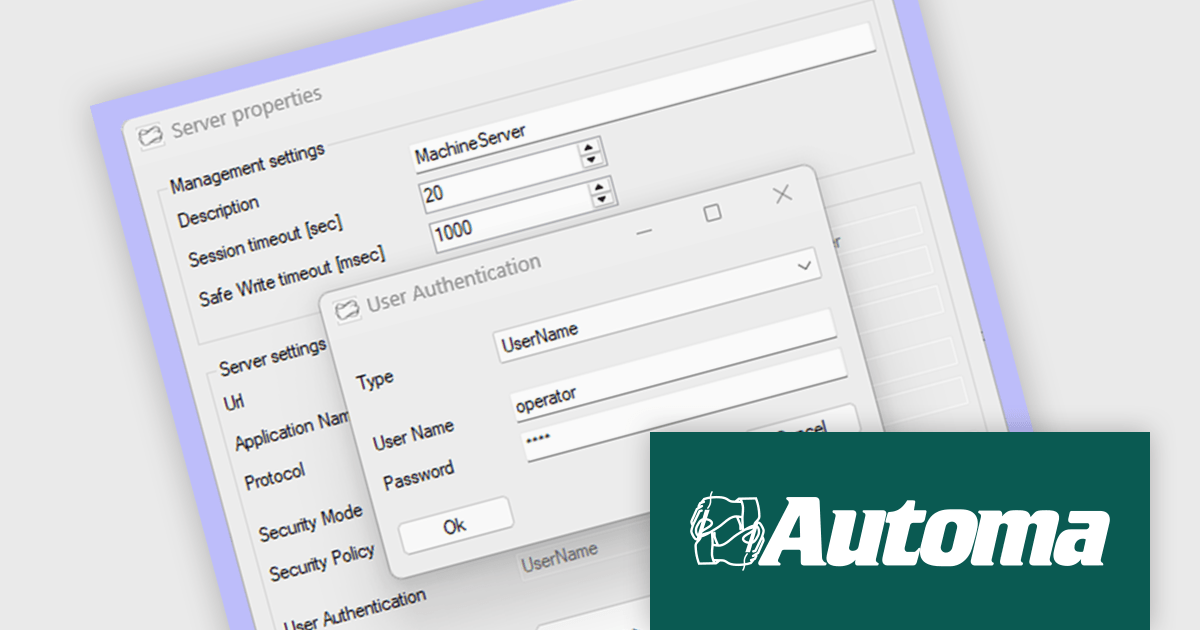
Automa OPC-UAC simplifies OPC UA (Open Platform Communications Unified Architecture) connectivity for Microsoft Windows applications, requiring fewer than ten function calls to establish communication. It links SCADA (Supervisory Control and Data Acquisition) and HMI (Human-Machine Interface) systems with MES (Manufacturing Execution Systems), facilitating real-time data exchange, precise timestamp tracking, and data quality management. With built-in DataChange Subscribers, developers can monitor industrial processes in real time. Multi-language support (C++, C#, VB) ensures flexibility for diverse development environments, making it an efficient tool for automation and machine-to-machine communication.
The OPC-UAC v2.0 update adds built-in support for user authentication through usernames and passwords. This enhancement aligns with standard OPC UA security practices, providing a straightforward way to enforce access control when connecting to servers. It helps developers and system administrators maintain secure communications across industrial systems that require user-level verification.
To see a full list of what's new in v2.0, see our release notes.
OPC-UAC is licensed per machine. Each machine running an application that includes the OPC-UAC library needs a license. see our OPC-UAC licensing page for full details.
For more information, visit our Automa OPC-UAC product page.
聯繫電話: (888) 850 9911
傳真: +1 770 250 6199


