


官方供應商
我們作為官方授權經銷商,直接提供超過200家開發廠家所發行超過1000個的產品授權給您。
請參閱我們所有的品牌。
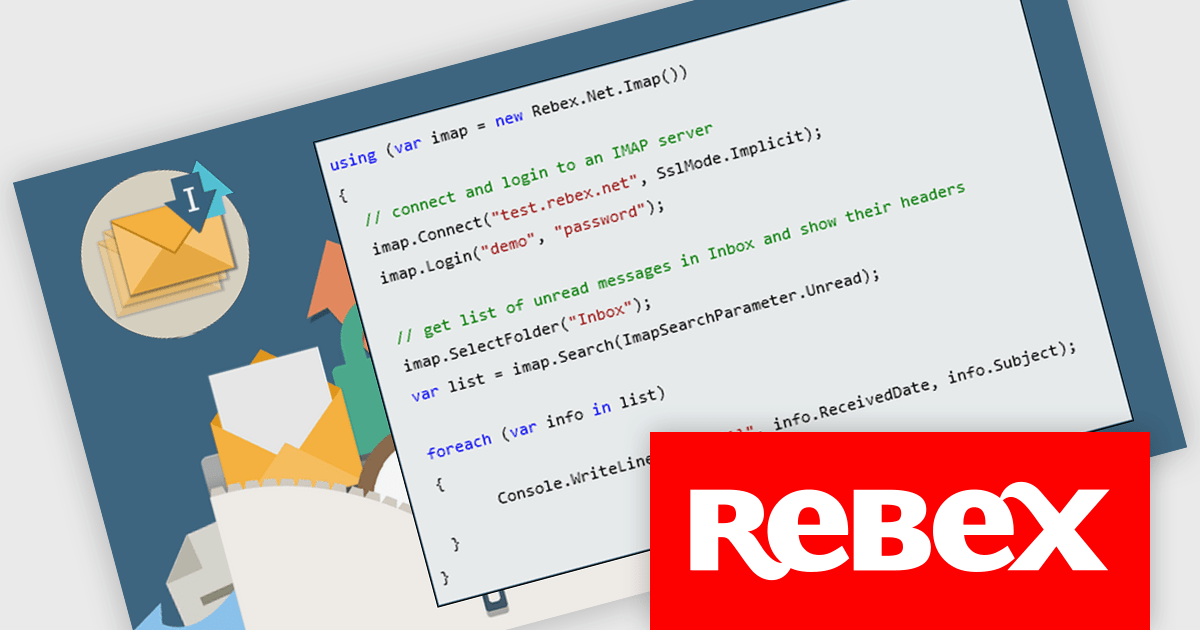
Rebex IMAP is a versatile new .NET library component that facilitates seamless interaction with IMAP servers for email management. It allows developers to efficiently receive, list, search, and delete messages, while providing enhanced security through TLS and S/MIME encryption. Additionally, its built-in SMTP support offers a complete solution for both sending and receiving emails, making it ideal for secure, reliable email communication in .NET applications.
Rebex IMAP is ideal for building custom email clients, automating workflows, and integrating secure email communication in business applications. Its ability to manage messages efficiently, makes it perfect for industries like finance, healthcare, and legal services that require data protection and compliance.
Rebex IMAP is licensed per developer and is available as a Perpetual License with a 1 Year Support Contract which includes priority support and all software updates. See our Rebex IMAP licensing page for full details.
Learn more on our Rebex IMAP product page.
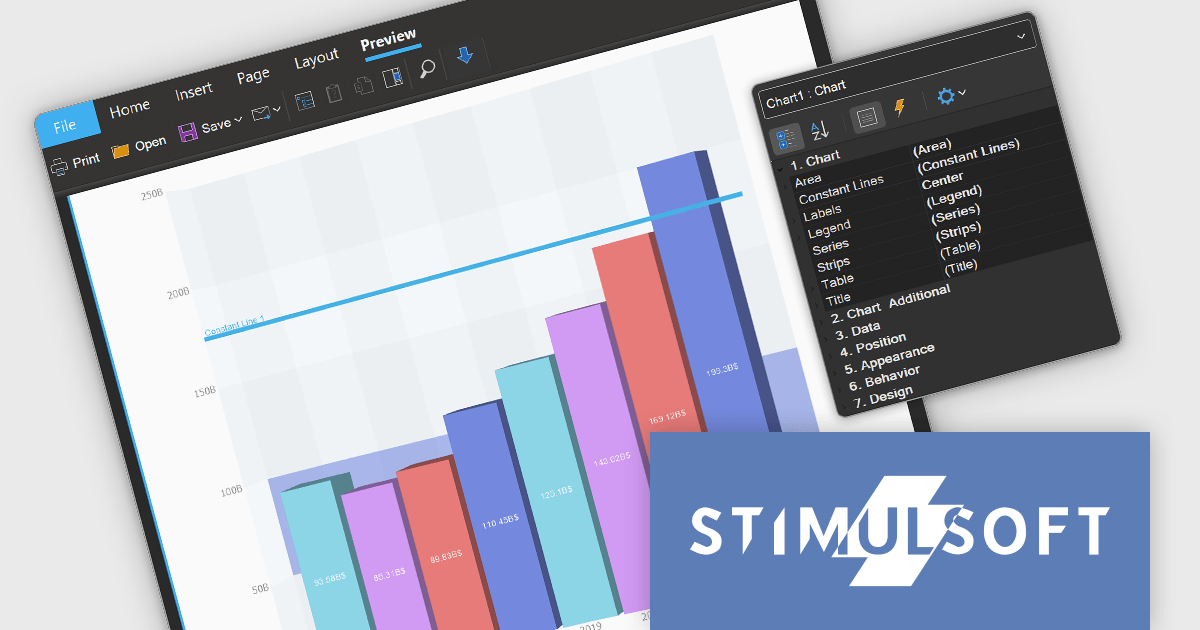
Stimulsoft Dashboards.WIN is a versatile suite of tools for crafting interactive data visualizations for web and desktop applications. It empowers developers to embed intuitive dashboards across various platforms, using platform-specific components or a centralized cloud designer. With data analysis elements, customization options, and pre-built templates, Stimulsoft Dashboards helps you transform complex data into clear, actionable insights for any audience.
Stimulsoft Dashboards.WIN 2024.4.1 introduces new functionality for 3D charts, including the ability to add constant lines and strips. This update ensures consistent styling across both 2D and 3D charts, making it easier to customize visualizations and enhance data clarity in reports and dashboards. These features provide greater flexibility for users to highlight key data points and trends, ensuring a more tailored and insightful presentation.
To see a full list of what's new in 2024.4.1, see our release notes.
Stimulsoft Dashboards.WIN is licensed per developer and is available as a perpetual license with 1 year support and maintenance. See our Stimulsoft Dashboards.WIN licensing page for full details.
Stimulsoft Dashboards.WIN is available in the following products:

FastReport .NET is a comprehensive reporting solution for .NET applications, offering a wide range of tools for creating, managing, and delivering reports. This software is designed to enable developers to integrate complex reporting functionalities directly into their .NET projects. Key features of FastReport .NET include an intuitive visual report designer, a powerful data processing engine, and support for a variety of export formats such as PDF, Excel, and Word. The product also supports data connectivity from multiple sources, including databases, XML files, and JSON. With its robust scripting capabilities, customizable templates, and ability to generate interactive reports, FastReport .NET provides developers with a versatile toolset for building high-performance, professional-grade reports suitable for business intelligence, data analysis, and presentation needs.
The FastReport .NET 2025.1 update introduces a valuable new feature that allows developers to add a report page as a link, instead of inserting the page into the report. This enhances report modularity and flexibility allowing developers to integrate external report pages into existing reports without duplicating content, simplifying maintenance and updates. By linking report pages, developers can efficiently reuse content across multiple reports, ensuring consistency while reducing the need for repetitive configuration. This feature is particularly advantageous for complex reporting scenarios where maintaining a single source of truth is essential.
To see a full list of what's new in 2025.1, see our release notes.
FastReport .NET is licensed per named user with options for Single, Team or Site Licenses. See our FastReport .NET Component Packages licensing page for full details.
Learn more on our FastReport .NET Component Packages product page.

Stimulsoft Dashboards.JS is a JavaScript library designed for building interactive dashboards within web applications. It offers a comprehensive suite of tools for data processing, visualization, and dashboard design. Compatible with any HTML5 browser, it allows you to create a variety of dashboards for various purposes and integrates seamlessly with popular JavaScript frameworks like React and Vue.js.
The Stimulsoft Dashboards.JS 2024.4.1 release introduces new white and black dashboard style along with a new preset style for report components which offers a modern, sleek aesthetic with improved readability, making key data more distinguishable and reducing eye strain. This design ensures consistency across reports, enhances brand cohesion, and provides a professional, visually engaging experience. With easy application and customizable elements, users can quickly adapt their dashboards to suit their needs, while maintaining a uniform look. Optimized for both desktop and mobile, this new style streamlines the creation of visually appealing, user-friendly reports.
To see a full list of what's new in 2024.4.1, see our release notes.
Stimulsoft Dashboards.JS is licensed per developer and is available as a Perpetual license with 1 year support and maintenance. See our Stimulsoft Dashboards.JS licensing page for full details.
Stimulsoft Dashboards.JS is available in the following products:

Vue diagrams are interactive visual representations, used to illustrate complex data structures, workflows, or system architectures. They leverage Vue's reactivity and component-based architecture to dynamically update as data changes, providing developers with an intuitive way to display and manage intricate relationships in real-time. Vue diagrams enhance the clarity of application logic, simplify debugging, and improve user experience by offering a clear, visual way to represent processes or data flows. This ultimately leads to more efficient development and better communication of complex concepts within the application.
Several Vue.js UI suites offer diagram controls including:
For an in-depth analysis of features and price, visit our Vue js UI suite comparison.
聯繫電話: (888) 850 9911
傳真: +1 770 250 6199


