


官方供應商
我們作為官方授權經銷商,直接提供超過200家開發廠家所發行超過1000個的產品授權給您。
請參閱我們所有的品牌。

Using JSON (JavaScript Object Notation) as a data source for charts allows applications to bind structured, lightweight data directly to visualization components. JSON represents data as objects and arrays, making it well suited to defining categories, series, and individual data points in a format that aligns naturally with modern web development practices. Its widespread use in RESTful APIs and web services enables charts to consume live or remote datasets efficiently, while reducing the need for complex data transformation before rendering.
Several Vue.js chart components allow you to use JSON as a data source, including:
For an in-depth analysis of features and price, visit our comparison of Vue.js charting components.
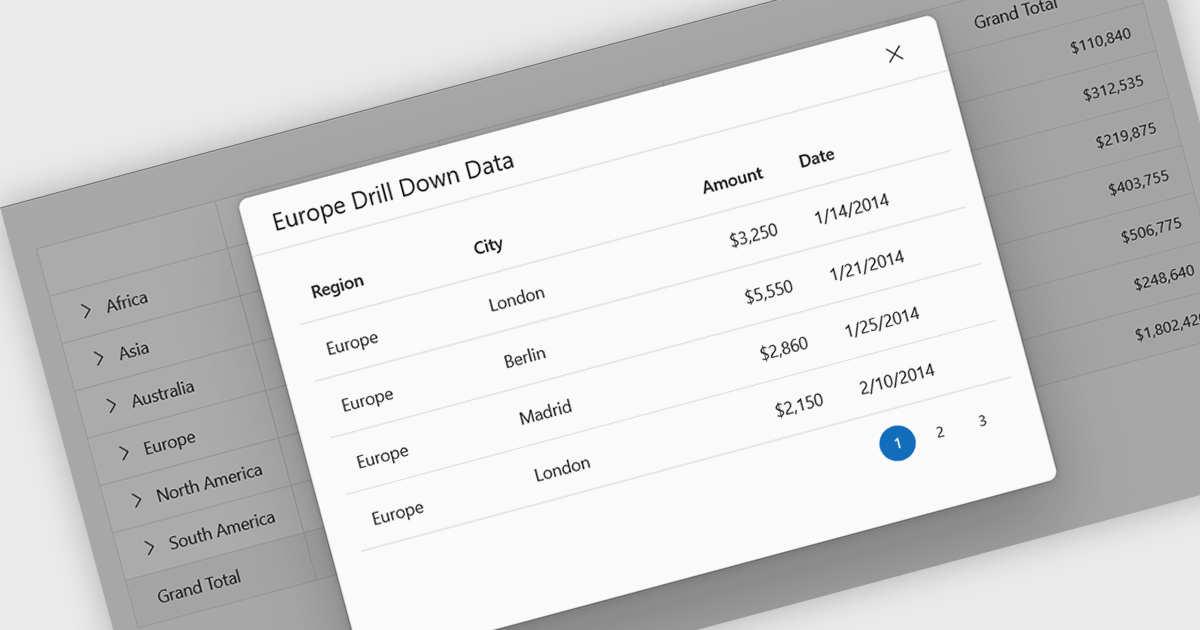
Drill-down support in a grid component allows users to move from summarized data to more detailed records within the same interface, often by expanding rows or selecting linked values that reveal related data. Instead of navigating to a separate page or view, users can access underlying information directly in context. For developers, this reduces the need for additional navigation and simplifies the presentation of hierarchical or related datasets. It also makes it easier to analyze data step by step, helping users inspect specific records or relationships without losing their place in the overall dataset.
Several React grid controls support drill-down features including:
For an in-depth analysis of features and price, visit our React grid controls comparison.
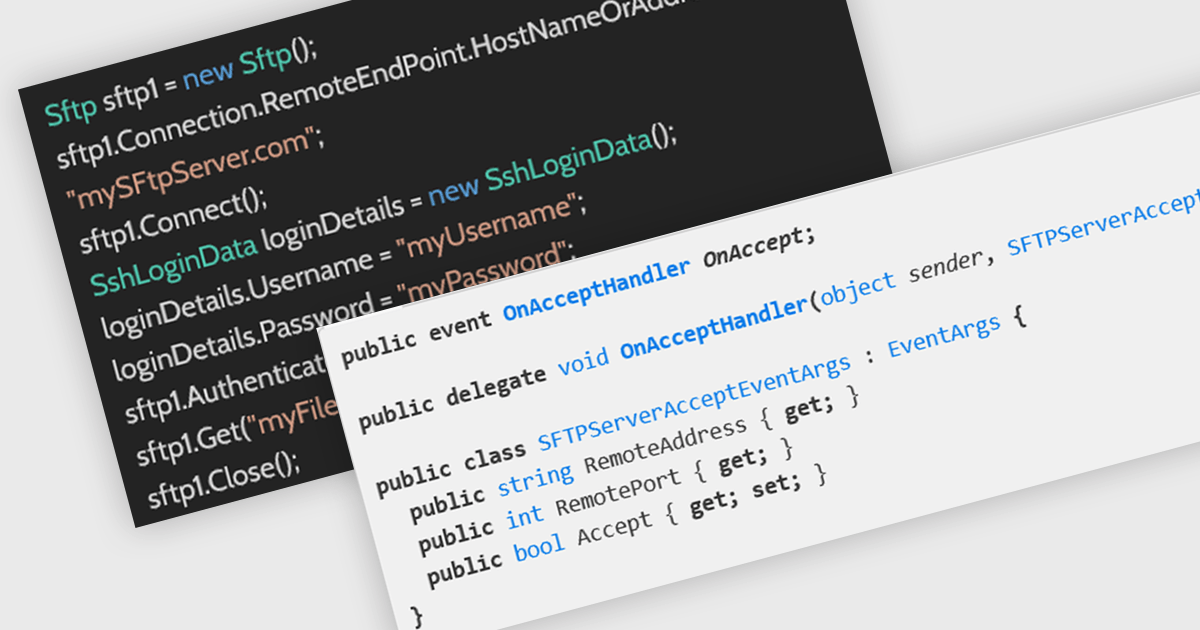
SFTP support in an internet communications .NET component refers to the ability to securely transfer files using the SSH File Transfer Protocol (SFTP), a network protocol that runs over Secure Shell (SSH) to provide encrypted file access, transfer, and management across systems. By integrating SFTP capabilities directly into a .NET application, developers can programmatically upload, download, and manage remote files while ensuring data confidentiality and integrity through strong encryption and authentication mechanisms such as passwords or public key pairs. This helps organizations meet security and compliance requirements when handling sensitive data across untrusted networks.
Several .NET communications and messaging components offer support SFTP including:
For an in-depth analysis of features and price, visit our comparison of .NET Comms & Messaging components.
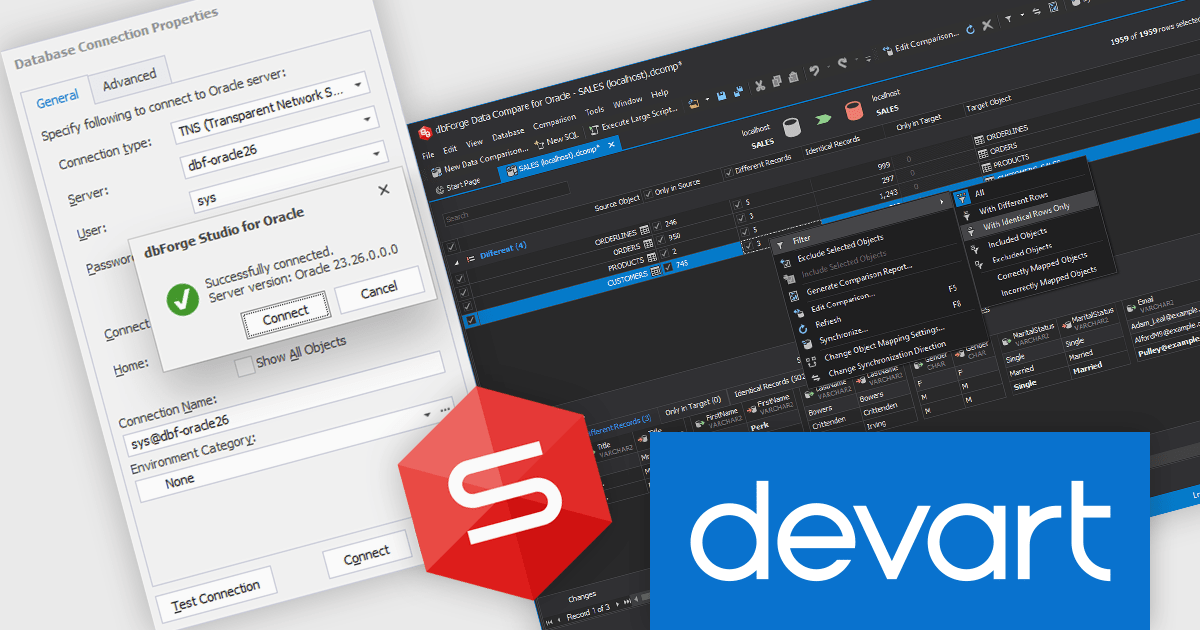
dbForge Studio for Oracle by Devart is an integrated development environment (IDE) designed to support Oracle database development, administration, and maintenance tasks within a unified interface. It provides tools for writing and debugging SQL and PL/SQL code, designing and modifying database objects, managing schema and data changes, and comparing and synchronizing databases. The product also includes features for query optimization, performance analysis, data import and export, and automated database deployment processes. By consolidating development and administrative capabilities into a single environment, it helps software developers and database administrators work more efficiently with Oracle Database systems across development, testing, and production scenarios..
The latest dbForge Studio for Oracle release provides support for Oracle AI Database 26ai, enabling software developers to build, test, debug, and deploy against the latest Oracle database release with full compatibility. This support ensures access to new AI-driven features, database objects, and performance enhancements introduced in Oracle 26ai. By eliminating version-related limitations and reducing upgrade complexity, teams can confidently modernize their environments, improve database management tasks, and maintain productivity across the entire development lifecycle.
dbForge Studio for Oracle is licensed per developer or per server and is available as an Annual or Perpetual License with a 12 month support and maintenance subscription. See our Devart dbForge Studio for Oracle licensing page for full details.
For more information, visit our dbForge Studio for Oracle product page.
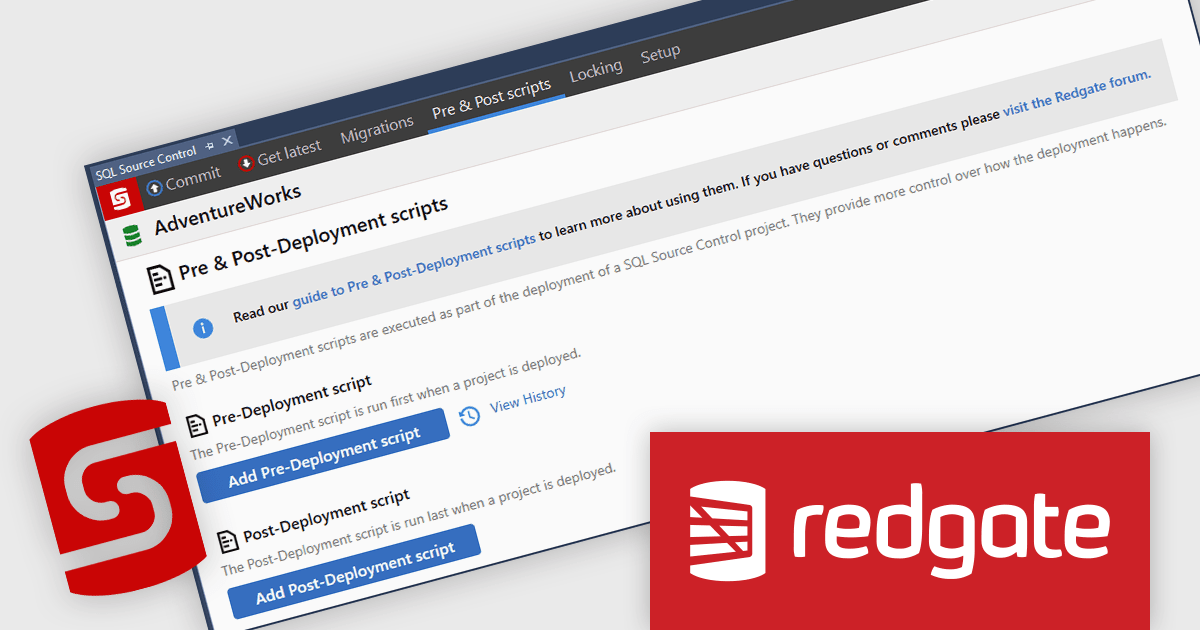
SQL Source Control enables teams to manage SQL Server database changes through version control, bringing the same discipline to databases as application code. Integrated directly into SQL Server Management Studio (SSMS) and compatible with Team Foundation Server and Subversion, it allows developers and DBAs to commit, track, and share changes without altering their workflow. By providing clear change tracking and version history, it reduces deployment risk, improves collaboration, and ensures consistency across development and production environments, making it ideal for teams adopting DevOps and structured release processes.
Redgate Software SQL Source Control automates SQL changes during deployments through pre- and post-deployment scripts, enabling developers to execute required data migrations, configuration updates, and custom logic in a controlled and repeatable manner. By managing these scripts within version control and integrating them into the deployment process, teams can ensure that all necessary changes are applied in the correct sequence alongside schema updates. This reduces manual intervention, minimizes deployment errors, improves consistency across environments, and supports more reliable, auditable release processes.
Redgate Software SQL Source Control is available as part of SQL Toolbelt Essentials or Flyway. Both are licensed per developer and are available as a 1, 2 or 3 year subscription license which includes full support plus all major versions of the software released during the subscription period. See our SQL Toolbelt Essentials licensing page or Flyway licensing page for full details.
For more information, visit our SQL Source Control product page.
聯繫電話: (888) 850 9911
傳真: +1 770 250 6199


