


官方供應商
我們作為官方授權經銷商,直接提供超過200家開發廠家所發行超過1000個的產品授權給您。
請參閱我們所有的品牌。
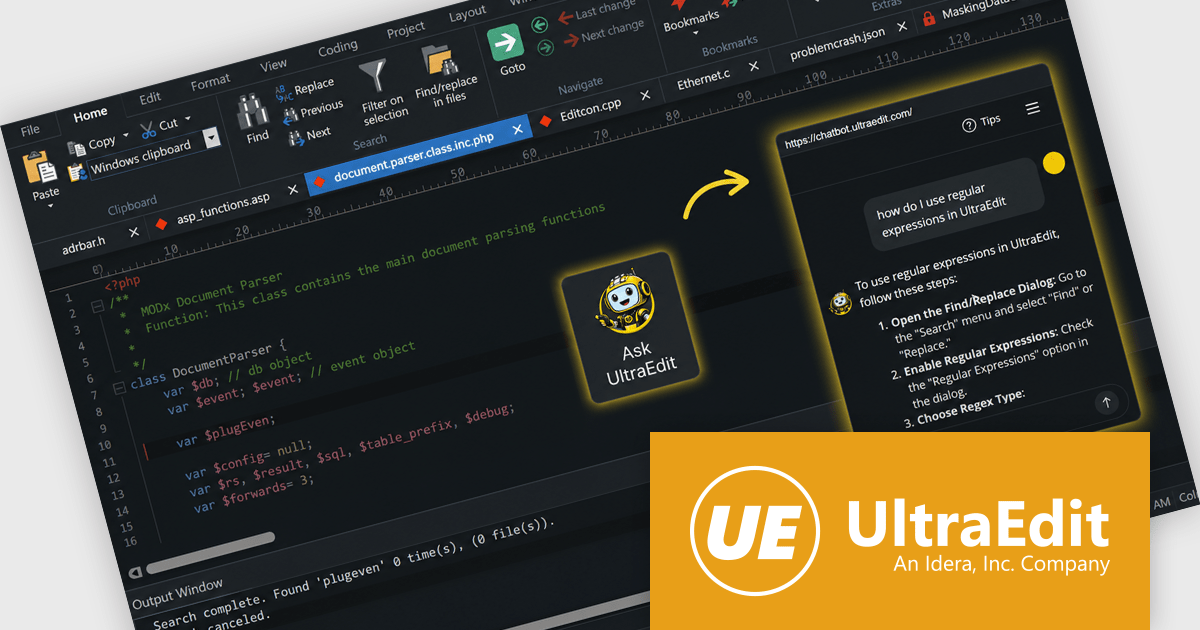
UltraEdit Core is a powerful text editor designed specifically for programmers, available on Windows, Linux, and macOS. It offers syntax highlighting and code structuring for a wide range of languages, enabling efficient code editing and comprehension. Additionally, UltraEdit Core supports large files beyond 4GB, regular expressions for complex searches, and integrates features like FTP, SSH, and scripting for streamlined development workflows.
The UltraEdit Core 2026.0 update introduces a built in AI assistant that helps software developers work more efficiently by providing instant access to feature guidance, workflow recommendations, and product expertise directly within the editor. Whether learning new capabilities, locating specific tools, validating editing approaches, or identifying the best feature for a particular task, developers can get immediate answers without leaving their workflow. This reduces the time spent searching documentation, accelerates onboarding for new users, and helps experienced users make better use of UltraEdit’s extensive functionality, resulting in a more productive and streamlined editing experience.
To see a full list of what's new in version 2026.0, see our release notes.
UltraEdit Core is licensed per user and is available as a Perpetual or Annual Subscription License. See our UltraEdit Core licensing page for full details.
UltraEdit Core is available to buy in the following products:
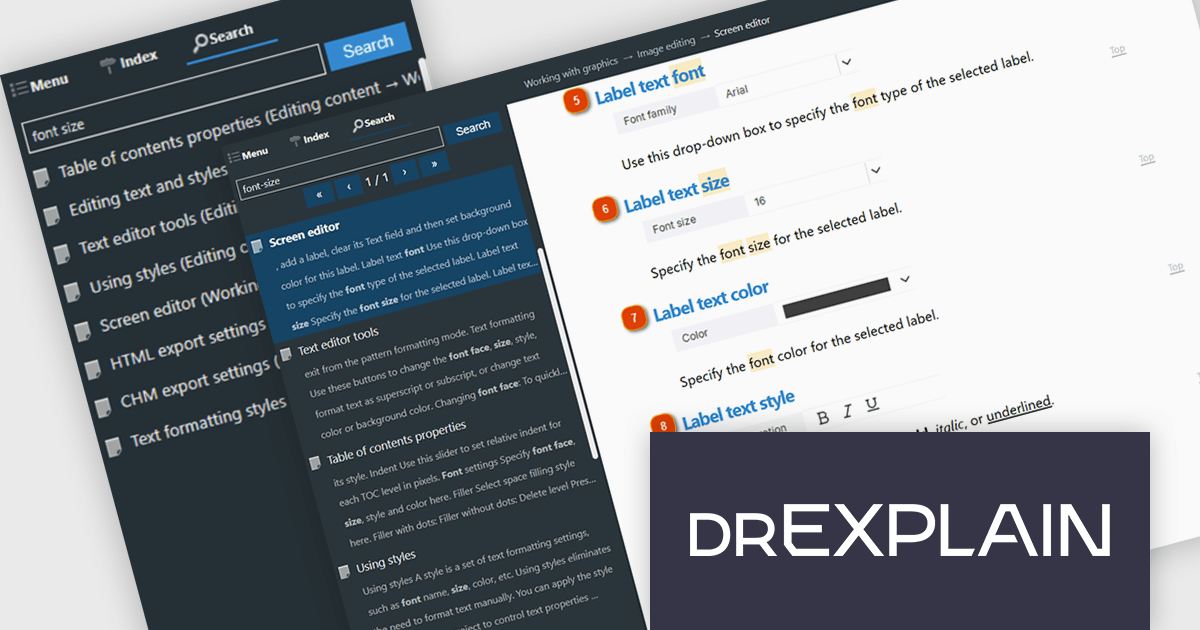
Dr.Explain by Indigo Byte Systems is a sophisticated software documentation tool designed to streamline the creation of detailed help files, user guides, online manuals, and technical documentation. It captures screenshots from a live software application or web site and allows you to directly embed explanations and instructions, reducing the time and effort required to produce high-quality, context-sensitive user guides. With robust features for editing and organizing content, Dr.Explain supports various output formats, including HTML, CHM, RTF, and PDF, ensuring compatibility with different platforms and user needs. This tool enhances productivity by streamlining the documentation process, enabling developers to produce professional and user-friendly documentation efficiently.
The Dr.Explain v7.1 update introduces advanced server side search for HTML documentation, helping developers deliver faster and more relevant search experiences across large documentation websites. By using intelligent ranking algorithms, synonym and word form recognition, contextual result highlighting, and support for advanced search queries, the new search system improves content discoverability and reduces irrelevant results. Running through a dedicated Docker based service, it also provides a scalable and centralized approach to search management, making it well suited for public facing and enterprise documentation deployments with large content libraries where search accuracy and performance are critical.
To see a full list of what's new in v7.1, see our release notes.
Dr.Explain is licensed per user-PC schema and is available as an annual license with Premium maintenance and free updates, or as a perpetual license with only Basic maintenance and minor updates. See our Dr.Explain licensing page for full details.
For more information, see our Dr.Explain product page.
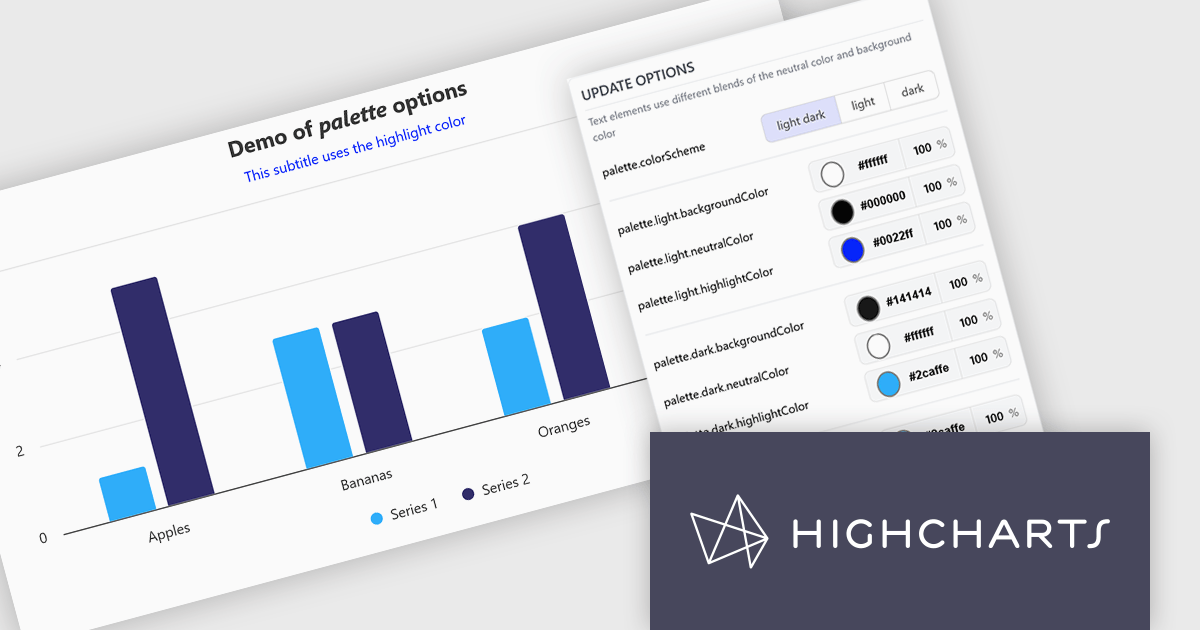
Highcharts is a JavaScript charting framework that allows web developers and data analysts to generate dynamic, visually appealing charts and graphs for websites and web applications. It can display a variety of chart types, including line, spline, area, column, bar, pie, scatter, and many more. Highcharts is well-known for its ease of use, rich documentation, and ability to handle huge datasets efficiently. Features include responsive design, accessibility support, and cross-browser compatibility. Its customization capabilities allow users to create bespoke data visualizations that increase engagement and provide insightful data presentations.
The Highcharts v13 update introduces a centralized color palette system that enables developers to define and manage chart colors, light and dark mode variations, and UI styling from a single configuration. By consolidating color settings across series, chart elements, and interactive states, it reduces repetitive configuration, simplifies brand consistency, and makes large chart collections easier to maintain. The addition of color scheme support and CSS variable exposure also allows charts to adapt more seamlessly to application themes and user preferences while providing greater flexibility for custom styling.
To see a full list of what's new in v13, see our release notes.
Highcharts Core is licensed on an annual or perpetual basis, OEM licenses, and Advantage Renewals. It is licensed per Developer and has several license options including Internal, SaaS, and Self Hosted. See our Highcharts Core licensing page for full details.
Learn more on our Highcharts Core product page.
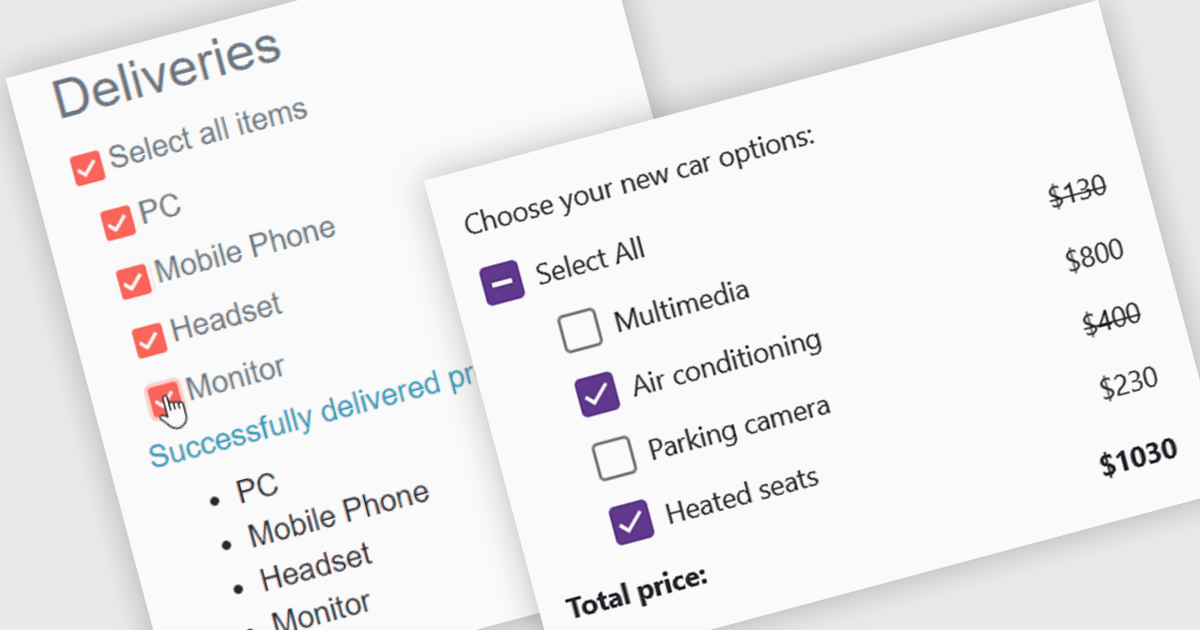
A checkbox data editor is a user interface element that enables users to view and modify Boolean values within forms, data grids, or other data-bound components. It provides an intuitive way to represent true/false, enabled/disabled, or selected/unselected states while maintaining synchronization between the user interface and the underlying data model. For developers, checkbox data editors simplify data entry and validation, improve usability by presenting state-based values in a familiar format, reduce input errors compared to manual text entry, and integrate with Blazor’s data binding and event-handling capabilities to support responsive, maintainable applications.
Several .NET Blazor data editor collections contain checkbox editors including:
For an in-depth analysis of features and price, visit our comparison of .NET Blazor data editors.
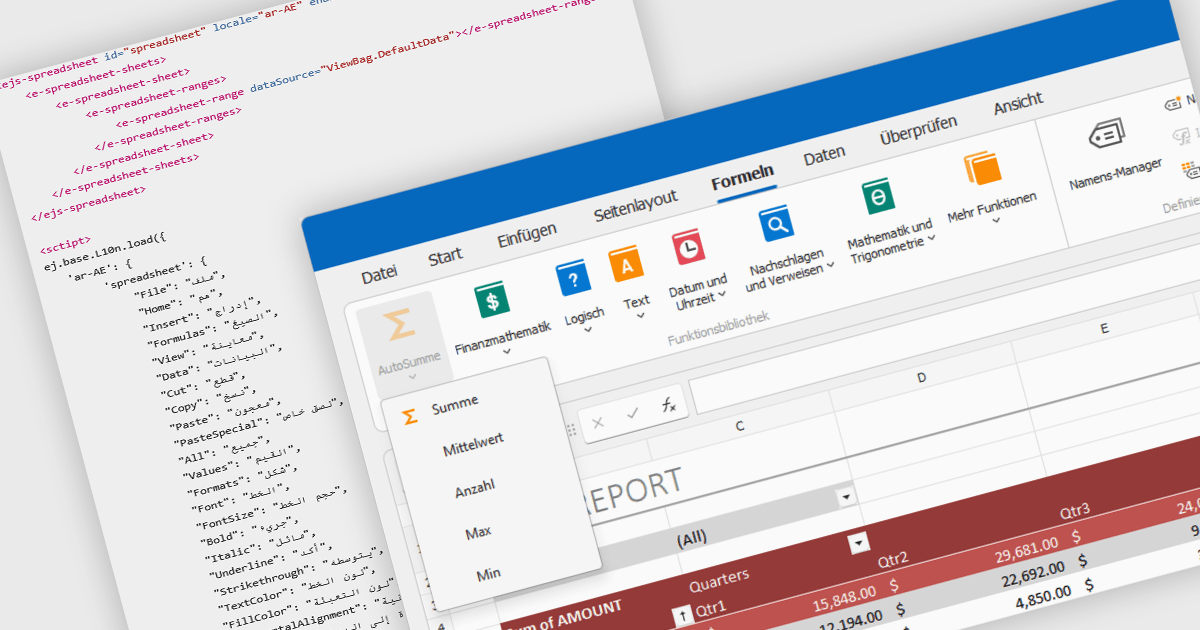
Localization in spreadsheet components enables applications to present spreadsheet interfaces, menus, dialogs, functions, and user-facing messages in the user's preferred language and regional format. This helps organizations deliver a more familiar and accessible experience to global audiences while supporting regional conventions such as date formats, number formatting, currencies, and translated interface elements. By adapting the spreadsheet environment to different languages and cultures, localization can improve usability, reduce training requirements, and help applications meet the expectations of international users.
Several ASP.NET Core spreadsheet controls offer support for localization including:
For an in-depth analysis of features and price, visit our ASP.NET Core spreadsheet controls comparison.
聯繫電話: (888) 850 9911
傳真: +1 770 250 6199


