


官方供應商
我們作為官方授權經銷商,直接提供超過200家開發廠家所發行超過1000個的產品授權給您。
請參閱我們所有的品牌。
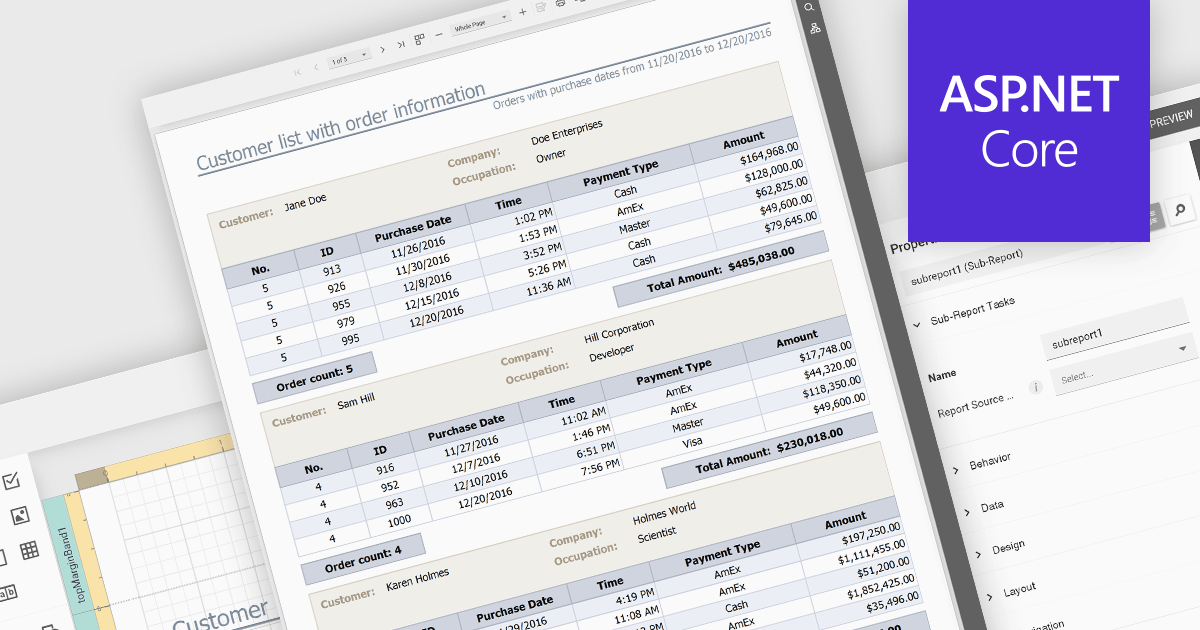
Subreports let you combine smaller reports into one, allowing you to present hierarchical or related data in a structured manner. They effectively function as modular components within a larger report, enhancing data organization and clarity. Subreports are useful for displaying detailed information associated with a main report's record, such as order items within an invoice or the sales history of a specific customer.
Several ASP.NET Core reporting controls offer support for subreports including:
For an in-depth analysis of features and price, visit our ASP.NET Core reporting controls comparison.
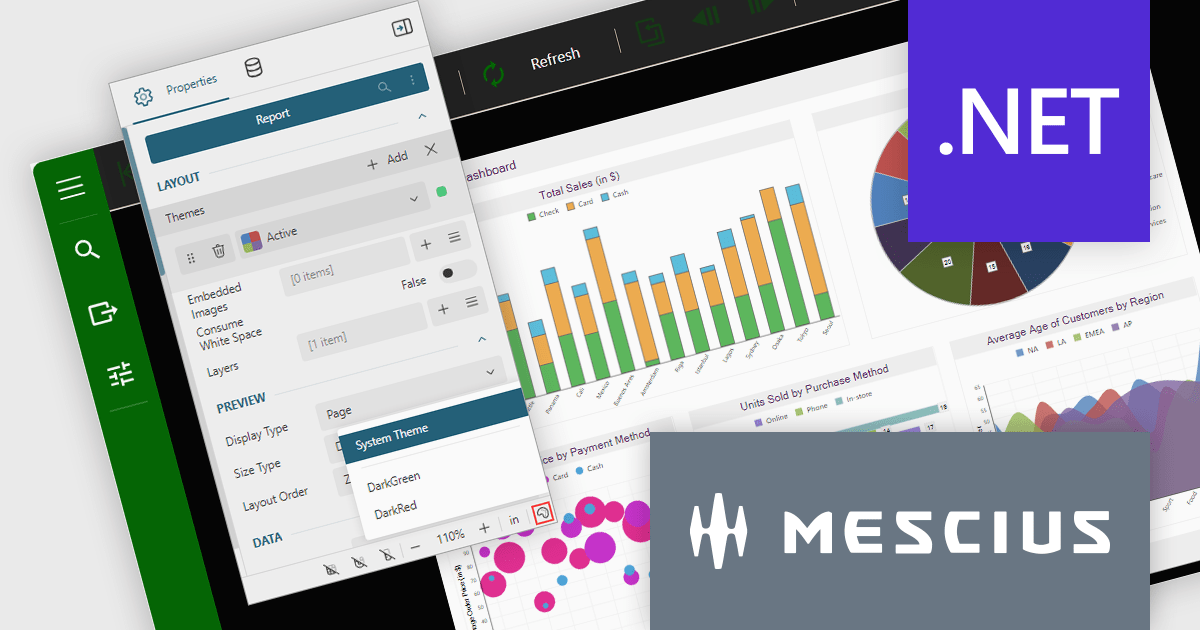
ActiveReports.NET is a reporting tool that allows developers to design and deliver reports with intuitive, reliable, and user-friendly report designers and controls. Features include the ability to create reports in a variety of formats, such as PDF, Excel, and HTML. ActiveReports.NET is also highly customizable, with an extensive API and advanced feature library.
ActiveReports.NET v18 brings robust theme support to its JS Viewer and Web Designer components, granting you extensive control over the user interface. Choose from a diverse selection of built-in UI themes for instant customization, or exercise fine-grained control by creating your own theme. This allows you to precisely match the components' appearance with your application's unique branding, ensuring a visually cohesive and professional user experience.
To see a full list of what's new in version 18, see our release notes.
ActiveReports.NET is licensed per developer and is available with or without a 12 month support and maintenance subscription. See our ActiveReports.NET licensing page for full details.
For more information, visit our ActiveReports.NET product page.
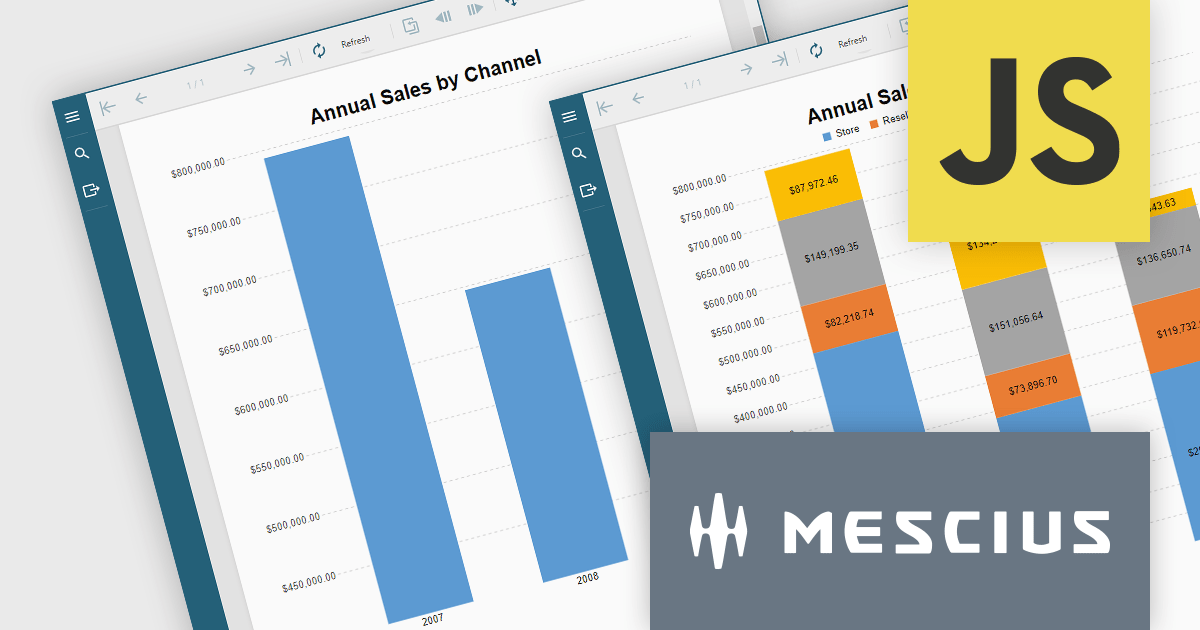
ActiveReportsJS is a reporting tool for web applications that allows developers and report authors to easily design and display reports within their applications. With a wide range of features, such as drill-down, runtime data filtering, and parameter-driven reports, as well as compatibility with popular frameworks, ActiveReportsJS simplifies the process of creating and managing reports.
In this blog post, MESCIUS Technical Engagement Engineer Joel Parks shows you how to utilize ActiveReportsJS to incoporate charts into your JavaScript report, and bind your chart data together through the use of parameterized drill-through navigation, allowing your users to easily traverse between them. Steps include:
Read the complete blog now, and start adding drill-through chart functionality to your JavaScript report using ActiveReportsJS.
ActiveReportsJS is licensed on an annual subscription or perpetual basis and is available as a Single Deployment License for non-commercial use, and as a Single Domain License or Unlimited Domain License for commercial and/or SaaS use. See our ActiveReportsJS licensing page for full details.
For more information, visit our ActiveReportsJS product page.
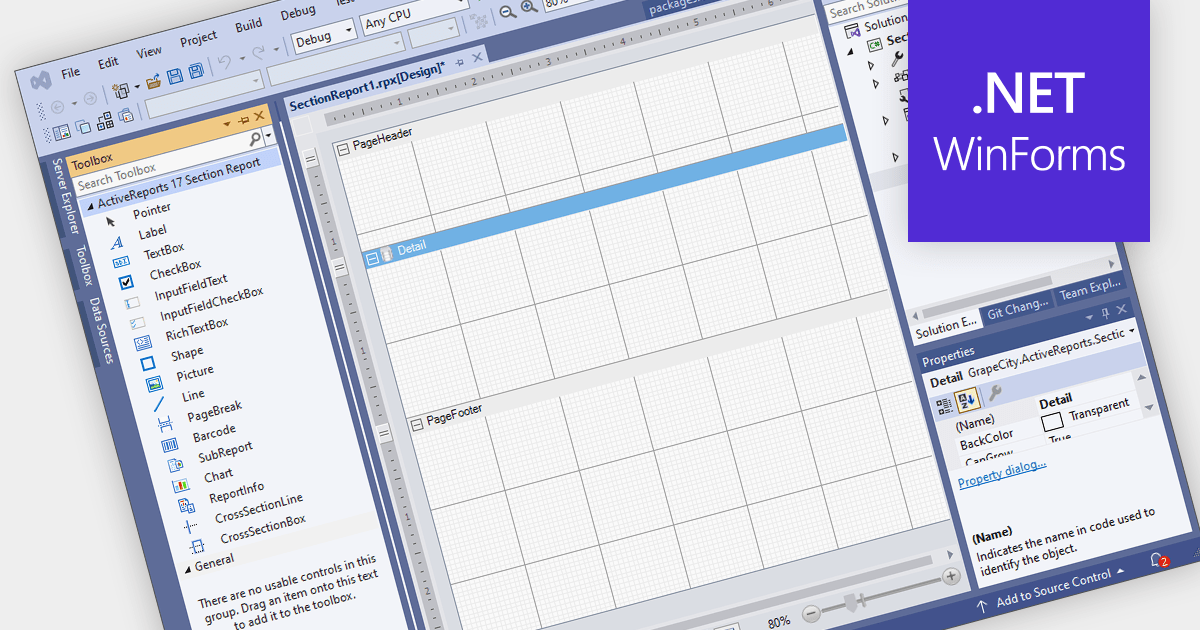
Visual Studio integrated report designers are comprehensive tools integrated into the Visual Studio development environment that enable software developers to design, create, and customize reports seamlessly within their projects. This feature streamlines the report creation process by providing a user-friendly interface for designing layout, formatting data, and integrating data sources directly within Visual Studio. Its benefits include increased productivity through the elimination of the need for external tools, enhanced collaboration among development teams, and improved efficiency in report development workflows, ultimately leading to faster delivery of high-quality reporting solutions in software applications.
Several .NET WinForms reporting controls offer Visual Studio integrated designers, including:
For an in-depth analysis of features and price, visit our WinForms reporting controls comparison.
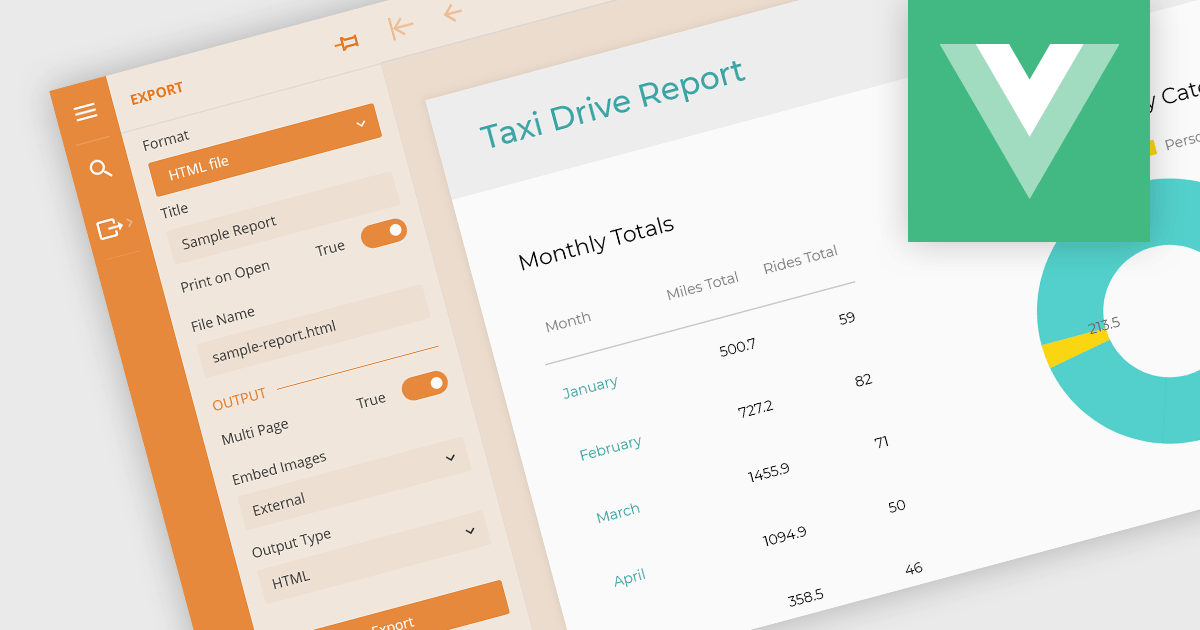
Being able to export to HTML is a valuable feature of a reporting application. Exporting reports to HTML files involves converting data visualizations and analytical summaries from a native format into web-friendly HTML pages. This allows for wider accessibility, sharing, and potentially embedding reports within websites. Static reports are transformed into interactive documents easily viewable on any device with a web browser. This format is ideal for sharing reports with collaborators, posting them online, or simply ensuring they remain accessible even if the original software becomes unavailable.
These Vue.js report components allow you to export reports to HTML files:
For an in-depth analysis of features and price, visit our comparison of Vue.js Reporting components.
聯繫電話: (888) 850 9911
傳真: +1 770 250 6199


