













官方供應商
我們作為官方授權經銷商,直接提供超過200家開發廠家所發行超過1000個的產品授權給您。
請參閱我們所有的品牌。
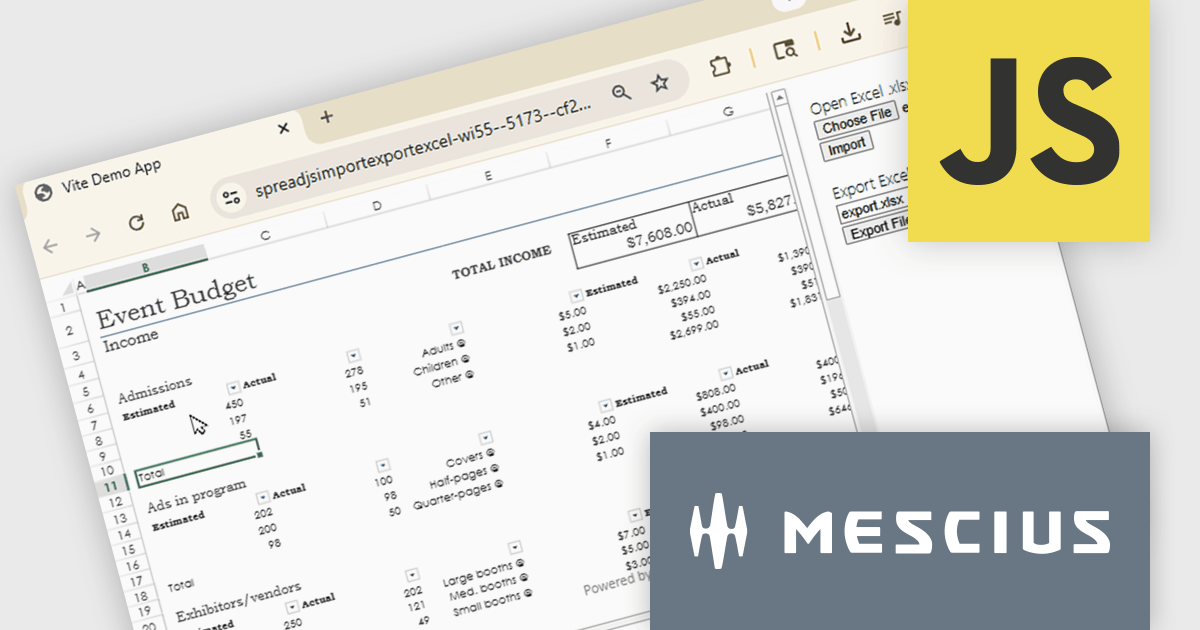
SpreadJS is a complete enterprise JavaScript spreadsheet solution used to create financial reports and dashboards, budgeting and forecasting models, scientific, engineering, healthcare, education, science lab notebooks, and other similar JavaScript business applications. Leverage the high-speed calculation engine with over 500 Excel built-in functions in 19 languages, to deliver true Excel-like spreadsheet experiences with zero dependencies on Excel.
In this online tutorial from MESCIUS, you will learn the critical steps allowing you to import/export XLSX files using JavaScript. Steps include:
Detailed sample code is included to help you along the way.
View the tutorial now and get started working with spreadsheet files in your JavaScript applications.
SpreadJS is licensed per developer and includes 1 Year Maintenance (major and minor version releases and unlimited support phone calls). SpreadJS requires an Annual or Perpetual Deployment License. The optional Add-ons are available at an additional cost, and require a SpreadJS license. See our SpreadJS licensing page for full details.
For more information, visit our SpreadJS product page.
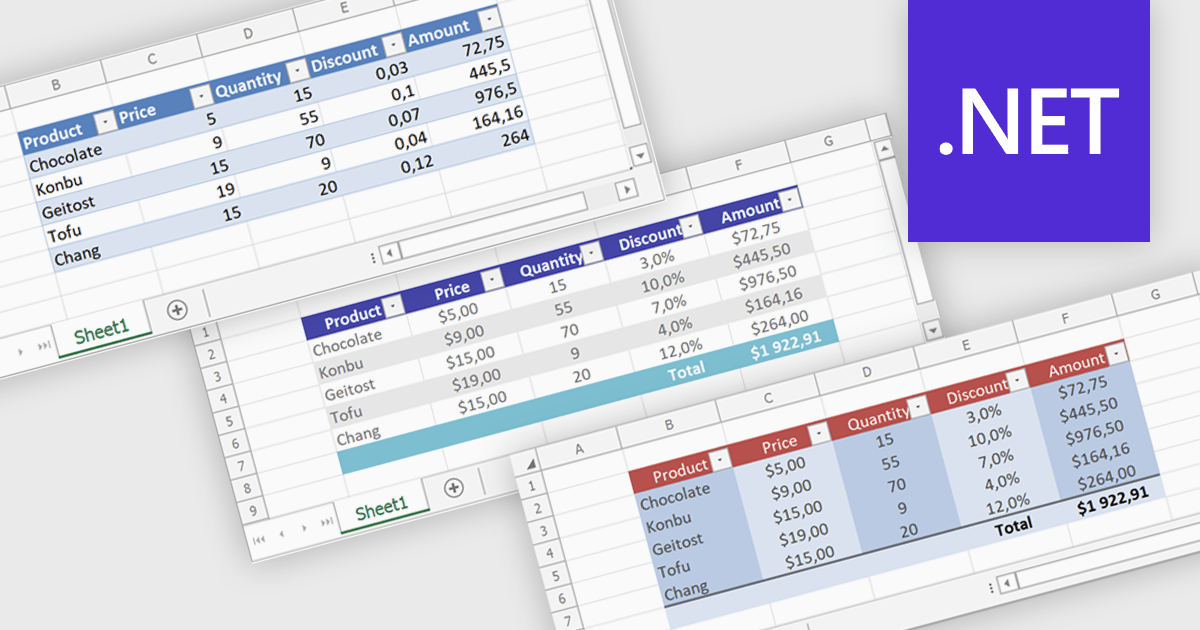
Spreadsheet tables provide a structured way to organize and manage data by grouping related information into defined rows and columns with built in functionality. They enhance usability by enabling automatic sorting and filtering, consistent formula application through calculated columns, and clearer data interpretation with structured references and styling. Tables can also expand dynamically as new data is added, reducing manual updates and errors. Common use cases include managing financial records, analyzing sales performance, tracking inventory, and working with data bound to external sources, making them a powerful tool for both everyday tasks and advanced data analysis.
Several .NET spreadsheet controls offer table support including:
For an in-depth analysis of features and price, visit our .NET spreadsheet controls comparison.
Syncfusion Essential Studio Spreadsheet Editor SDK is a library that lets developers embed spreadsheet functionality into web and desktop applications without requiring Microsoft Excel. It supports editing, formatting, and data analysis features such as cross sheet formula calculation, data binding to local and remote sources including JSON and REST, conditional cell styling, charts, data validation, worksheet protection, and workbook permissions. Available across frameworks including Blazor, React, Angular, Vue, JavaScript, ASP.NET Core and MVC, WPF and WinForms, it helps teams deliver a familiar spreadsheet experience for use cases like reporting, budgeting, and forecasting directly within their applications.
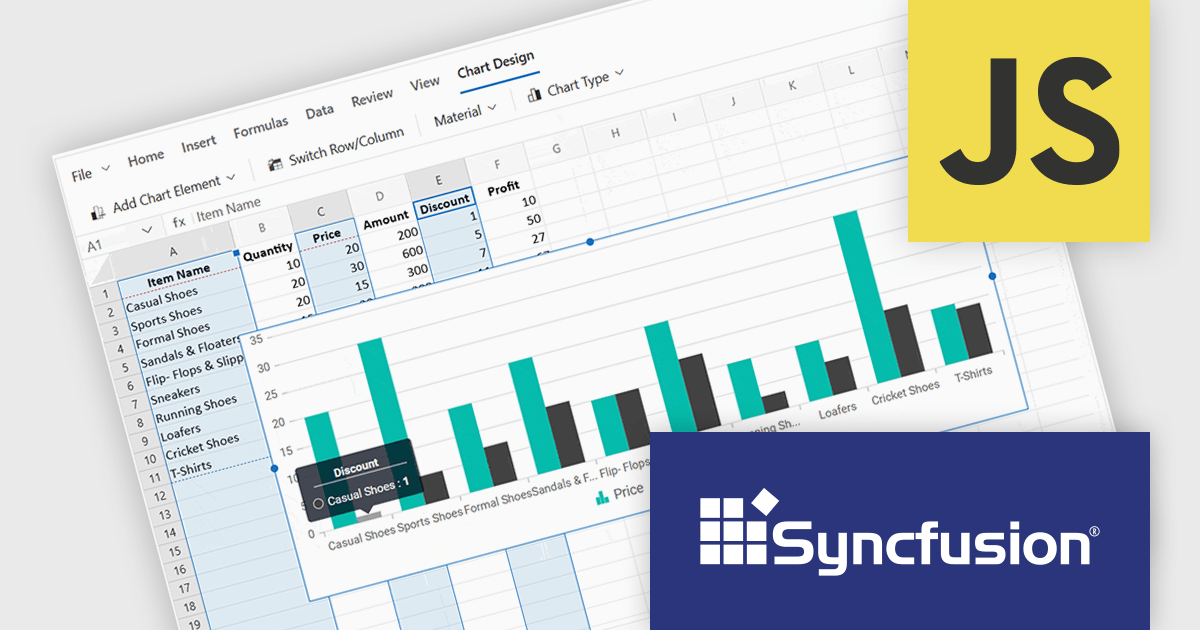
The Syncfusion Essential Studio Spreadsheet Editor SDK 2026 Volume 1 update introduces discontinuous chart range support, enabling developers to create charts from multiple non-adjacent rows, columns, or cell ranges without modifying the original data structure. This capability provides greater flexibility when working with complex, fragmented, or selectively relevant datasets, eliminating the need for manual data consolidation or duplication. It also ensures that charts remain automatically synchronized with updates across all referenced ranges, supporting more accurate, efficient, and maintainable data visualization within modern web and enterprise applications.
To see a full list of what's new in Syncfusion Essential Studio Spreadsheet Editor SDK 2026 Volume 1 (33.1.45), see our release notes.
Syncfusion Essential Studio Spreadsheet Editor SDK is licensed per developer on a one year timed subscription basis, with runtime royalty free redistribution included when the subscription is current, and includes one year of unlimited technical support and updates. See our Syncfusion Essential Studio Spreadsheet Editor SDK licensing page for full details.
Learn more on our Syncfusion Essential Studio Spreadsheet Editor SDK product page.
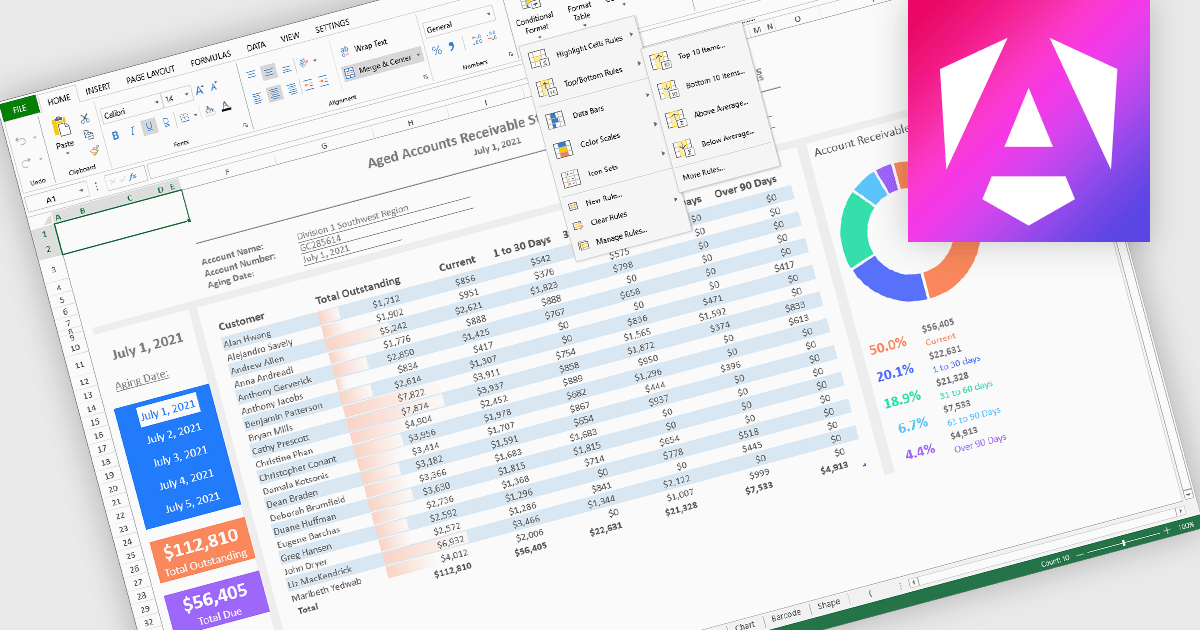
Conditional formatting in spreadsheet components allows developers to dynamically change the appearance of cells based on their values or defined rules. This feature helps highlight important data points, trends, and exceptions without requiring manual updates, making it easier for users to interpret large datasets at a glance. By applying visual cues such as colors, icons, and data bars, conditional formatting enhances readability and supports faster, more informed decision-making within spreadsheet-driven applications.
Several Angular spreadsheet controls offer support for conditional formatting including:
For an in-depth analysis of features and price, visit our Angular spreadsheet controls comparison.
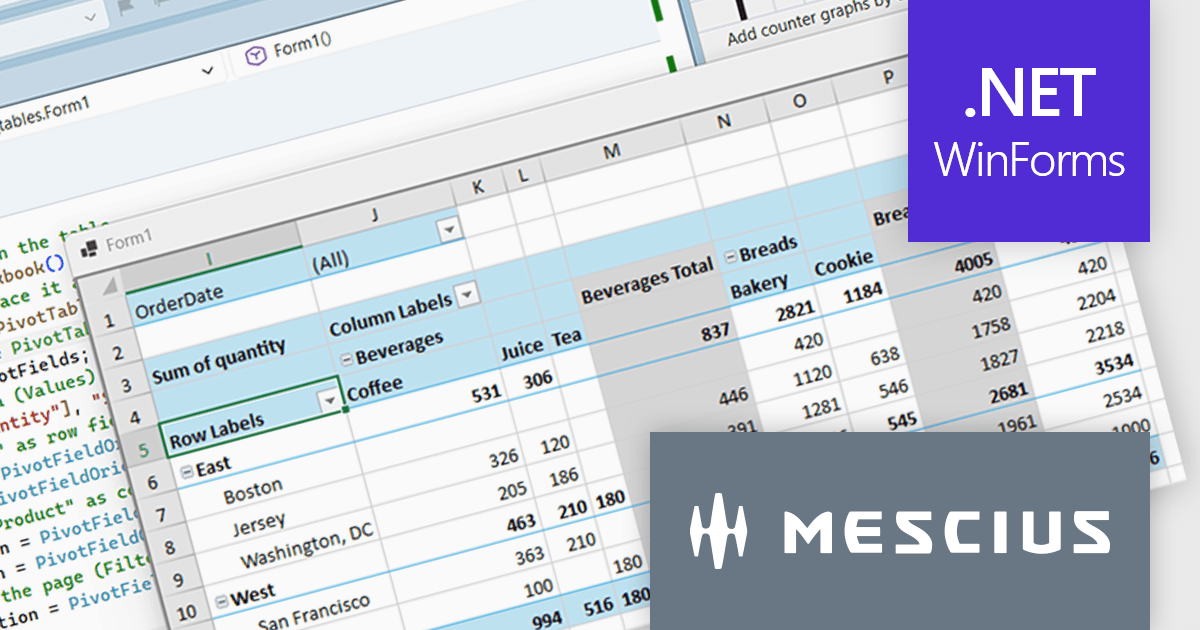
Spread.NET helps you create spreadsheets, grids, dashboards, and forms. It includes a powerful calculation engine with 450+ functions and the ability to import and export Excel spreadsheets. Leverage the extensive .NET spreadsheet API and powerful calculation engine to create analysis, budgeting, dashboard, data collection and management, scientific, and financial applications.
In this blog post, MESCIUS Product Marketing Specialist Mackenzie Albitz demonstrates how to build a Pivot Table using the Spread.NET WinForms component, enabling your users to quickly analyze large datasets with the ability to summarize, group, and reorganize data. Creating the Pivot Table includes the following steps:
Detailed source code and sample data are included to assist you along the way.
Read the complete blog post to learn how to integrate a spreadsheet component into your .NET applications and provide your users with familiar spreadsheet functionality without referring them to an external program.
Spread.NET is licensed per developer and is available as either a Perpetual or Annual license, depending upon geographic location. We can supply any Spread.NET license including new licenses, maintenance renewals, and upgrade licenses. See our Spread.NET licensing page for full details.
For more information, visit our Spread.NET product page.
聯繫電話: (888) 850 9911
傳真: +1 770 250 6199


