


官方供應商
我們作為官方授權經銷商,直接提供超過200家開發廠家所發行超過1000個的產品授權給您。
請參閱我們所有的品牌。
DataSpell by JetBrains is an Integrated Development Environment (IDE) specifically designed for data analysts and engineers. It allows you to write Python scripts, run SQL queries, analyze data in Jupyter notebooks, manage dbt workflows, and connect to databases, all within one interface. DataSpell helps you to stay focused on exploring insights and delivering high-quality results by combining rich data analysis tools with features like real-time error checking, code quality analysis, and built-in support for best practices like testing and documentation.
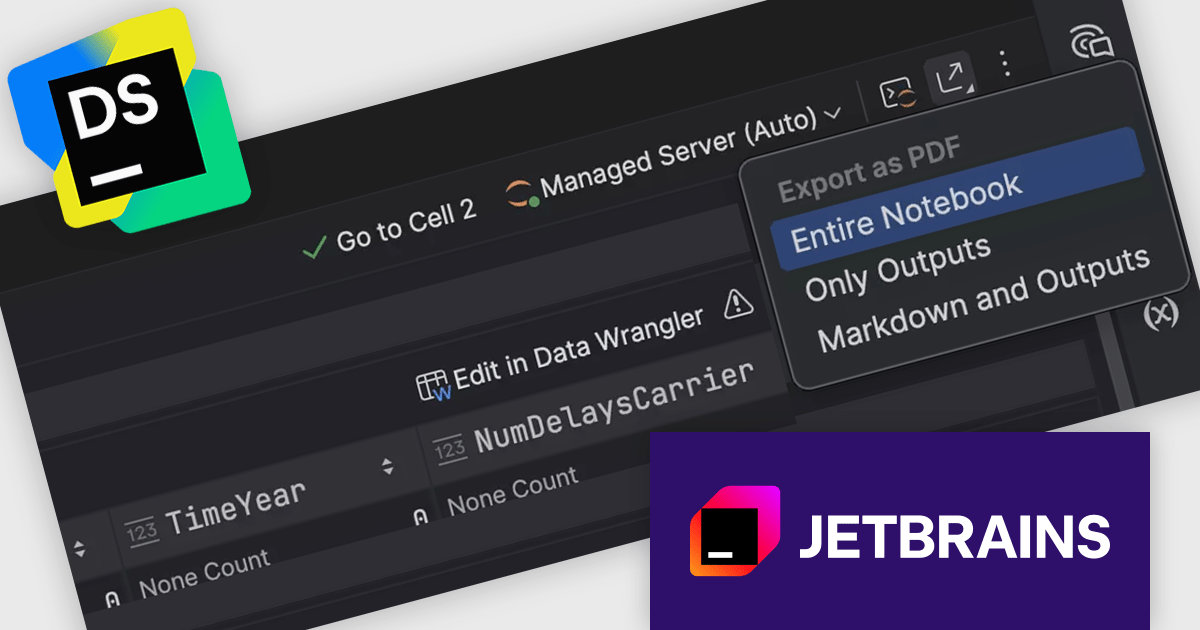
The DataSpell 2026.1 update now supports native export of Jupyter notebooks to PDF, removing the need for external tools such as Python, nbconvert, or LaTeX. The conversion process runs entirely within the IDE, which reduces setup effort and avoids common configuration issues. This results in a faster and more consistent way to produce clean, shareable documents, making it easier to move from analysis to distribution without leaving the development environment.
To see a full list of what's new in version 2026.1, see our release notes.
DataSpell is licensed per user, and is available as a commercial annual subscription license. We can supply new subscriptions, subscription renewals, lapsed renewals, and additional user licenses. See our DataSpell licensing page for full details.
DataSpell is available to buy in the following products:
DataGrip is a multi-engine database environment that supports MySQL, PostgreSQL, Microsoft SQL Server, Oracle, Sybase, DB2, SQLite, HyperSQL, Apache Derby and H2. It includes an editor that provides intelligent coding assistance such as auto-completion, analysis and navigation. It also features a query console for running and profiling queries.
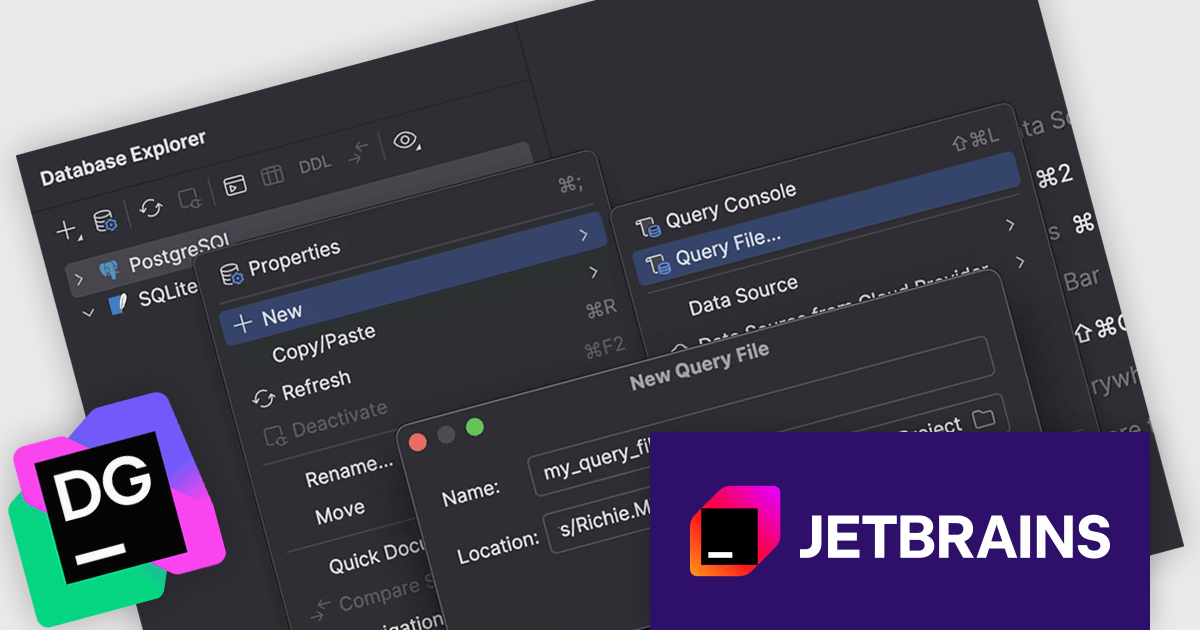
The DataGrip 2026.1 update introduces a redesigned flow for creating and managing query files. Developers can now choose to work exclusively with query files, rely solely on query consoles, or combine both approaches within the same session. This flexibility supports a wider range of workflows, whether you are iterating quickly in a console or maintaining structured, reusable SQL in files, helping teams adapt the environment to their specific needs without friction.
To see a full list of what's new in version 2026.1, see our release notes.
DataGrip is licensed per user, and is available as a commercial annual subscription license. We can supply new subscriptions, subscription renewals, lapsed renewals, and additional user licenses. See our DataGrip licensing page for full details.
DataGrip is available to buy in the following products:
Sencha Ext JS is an enterprise-focused JavaScript framework for building complex, data-intensive web applications, particularly business software such as dashboards, admin systems, reporting tools, and other large-scale user interfaces. It provides a broad library of prebuilt components, including grids, charts, forms, layouts, and data handling features, along with supporting tools for theming, testing, and application development, which helps teams create consistent, cross-platform applications more efficiently. In practice, Ext JS is best known for its strong support for rich user interfaces and large datasets, making it a good fit for organisations that need robust, maintainable front-end applications rather than lightweight websites.
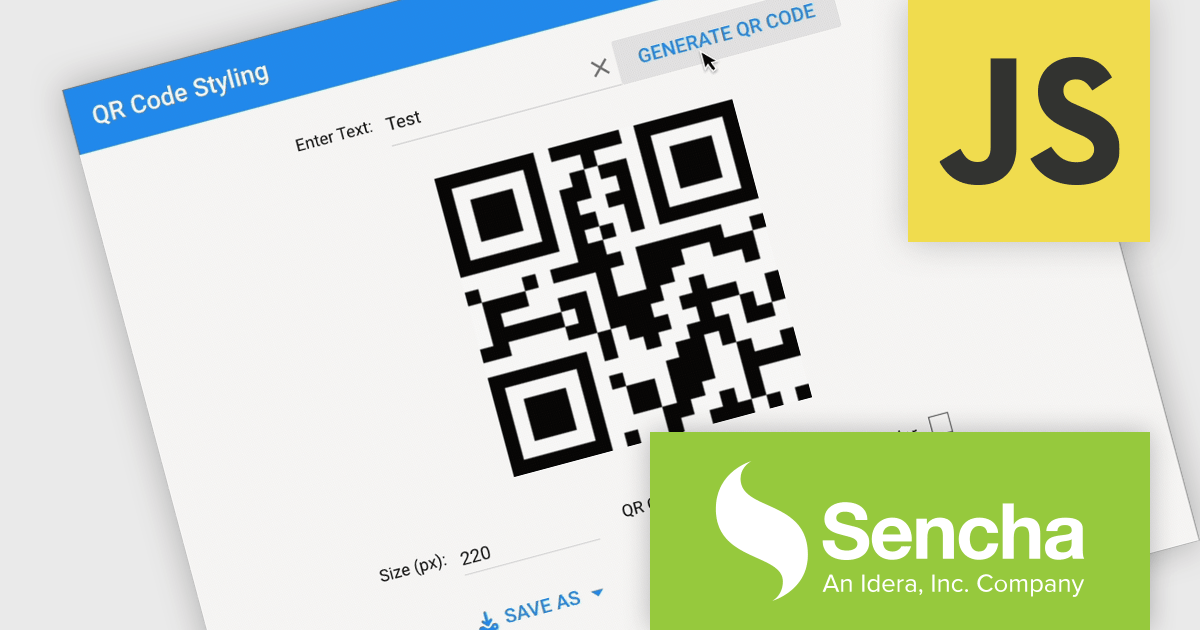
The Sencha Ext JS v8.0 update adds QR Code Reader/Generator functionality that lets developers generate and read QR codes directly within applications across both the Modern and Classic toolkits. It supports use cases such as payments, data sharing, contact exchange, calendar events, geolocation, phone and SMS, email, and Wi-Fi configurations, while also providing rendering options including SVG, Canvas, and PNG, plus image download, clipboard copy, preview, responsive sizing, customization, and input sanitization. The result is a built-in way to add QR code barcode capabilities to enterprise applications with broad format support and flexible configuration.
To see a full list of what's new in v8.0, see our release notes.
Sencha Ext JS is available in Pro, Enterprise and Ultimate editions, as Annual Subscription Licenses. See our Sencha Ext JS licensing page for full details.
For more information, see our Sencha Ext JS product page.

JetBrains GoLand is a dedicated integrated development environment (IDE) designed for Go programmers. It offers comprehensive features like intelligent code completion, advanced debugging tools, built-in testing frameworks, and code navigation aids for both individual and collaborative development. GoLand's focus on efficiency and productivity, along with its integration with other JetBrains tools, makes it a powerful choice for professional Golang development.
The GoLand 2026.1 update introduces syntax update alerts that automatically scan projects when a new Go version is adopted, identifying areas where code can be improved using newer language features. Each alert provides clear context on what can be updated and why, making it easier to understand the value of the change rather than simply applying it. These suggestions are presented with distinct highlighting and a dedicated icon, ensuring they are visible without being disruptive.
To see a full list of what's new in version 2026.1, see our release notes.
GoLand is licensed per user, and is available as a commercial annual subscription license. We can supply new subscriptions, subscription renewals, lapsed renewals, and additional user licenses. See our GoLand licensing page for full details.
GoLand is available to buy in the following products:
RubyMine by JetBrains is a Integrated Development Environment (IDE) specifically designed for Ruby and Ruby on Rails development. It offers a comprehensive suite of features to improve your coding efficiency, including smart code completion, syntax highlighting, code refactoring tools, built-in debugging and testing frameworks, and integration with popular libraries and databases. Whether you're a seasoned Rails developer or just starting out, RubyMine's intuitive interface and robust features can help you write cleaner, more maintainable code and accelerate your development.
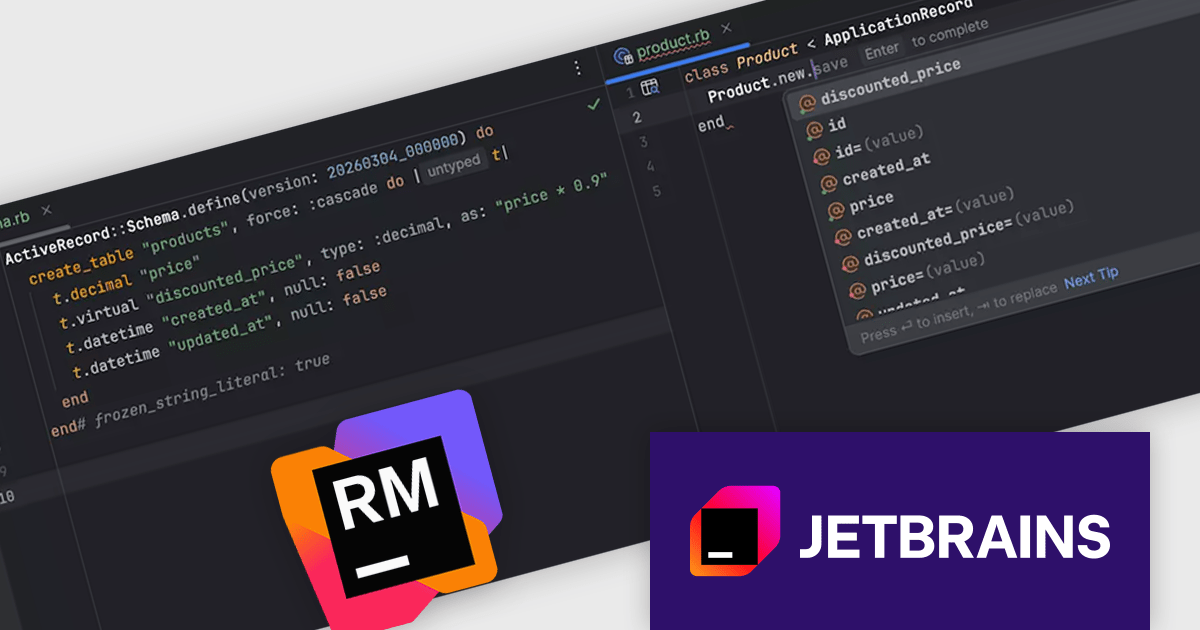
The RubyMine 2026.1 release introduces support for virtual (non-persisted) generated columns in PostgreSQL 18 and later, bringing them fully into the Rails development experience. The IDE recognizes these columns as attributes within models, enabling accurate code completion, reliable type inference, and direct navigation to their definitions in 'schema.rb'.
To see a full list of what's new in version 2026.1, see our release notes.
RubyMine is licensed per user, and is available as a commercial annual subscription license. We can supply new subscriptions, subscription renewals, lapsed renewals, and additional user licenses. See our RubyMine licensing page for full details.
RubyMine is available to buy in the following products:
聯繫電話: (888) 850 9911
傳真: +1 770 250 6199


