


官方供應商
我們作為官方授權經銷商,直接提供超過200家開發廠家所發行超過1000個的產品授權給您。
請參閱我們所有的品牌。
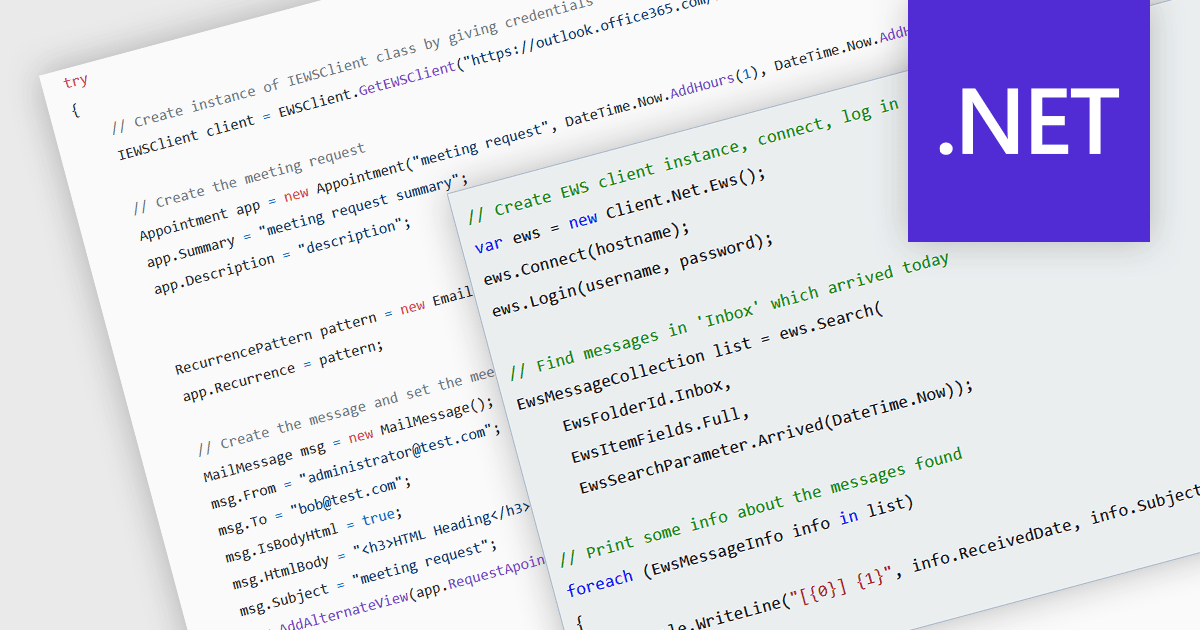
Communications components that support Exchange Web Services (EWS) bridge the gap between your .NET applications and Microsoft Exchange servers. These components provide a user-friendly interface for interacting with Exchange data, allowing you to send and receive emails, manage calendars and contacts, and access folders and attachments. This simplifies development and empowers your applications to leverage the robust features of Exchange, making them ideal for building email clients, workflow automation tools, or internal communication platforms within organizations that rely heavily on Exchange for collaboration.
Several .NET communications and messaging components offer EWS support:
For an in-depth analysis of features and price, visit our comparison of .NET communications and messaging components.
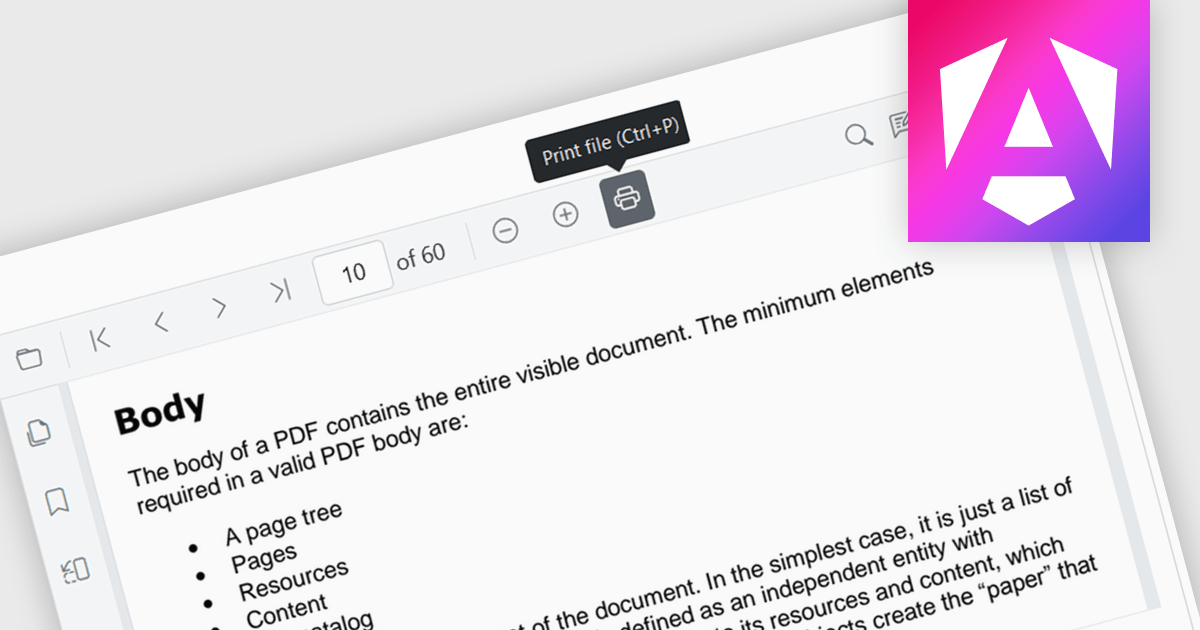
Enhance your Angular application's functionality with PDF viewer components that offer built-in printing support. This popular feature allows users to seamlessly print documents directly from your web app, eliminating the need for external downloads or software. Printing support provides benefits including increased efficiency, improved user experience, and better document control, making it ideal for scenarios where users need to generate physical copies of reports, contracts, or other vital documents.
Several Angular PDF viewer components include support for printing, including:
For an in-depth analysis of features and price, visit our comparison of Angular PDF viewer components.

Structured document tools enable automated C# code generation based on predefined templates and embedded metadata. This process involves using tools that interpret the document's structure and content, such as XML or JSON schemas, to produce well-organized and consistent C# code. The benefits of this approach include increased development efficiency, reduced risk of human error, and enhanced maintainability. By automating repetitive and boilerplate coding tasks, developers can focus on more complex and value-added aspects of the application, ensuring higher code quality and faster time to market. This technique also promotes standardization and consistency across the codebase, facilitating easier updates and modifications.
Several structured document tools offer C# code generation including:
For an in-depth analysis of features and price, visit our structured document tools comparison.
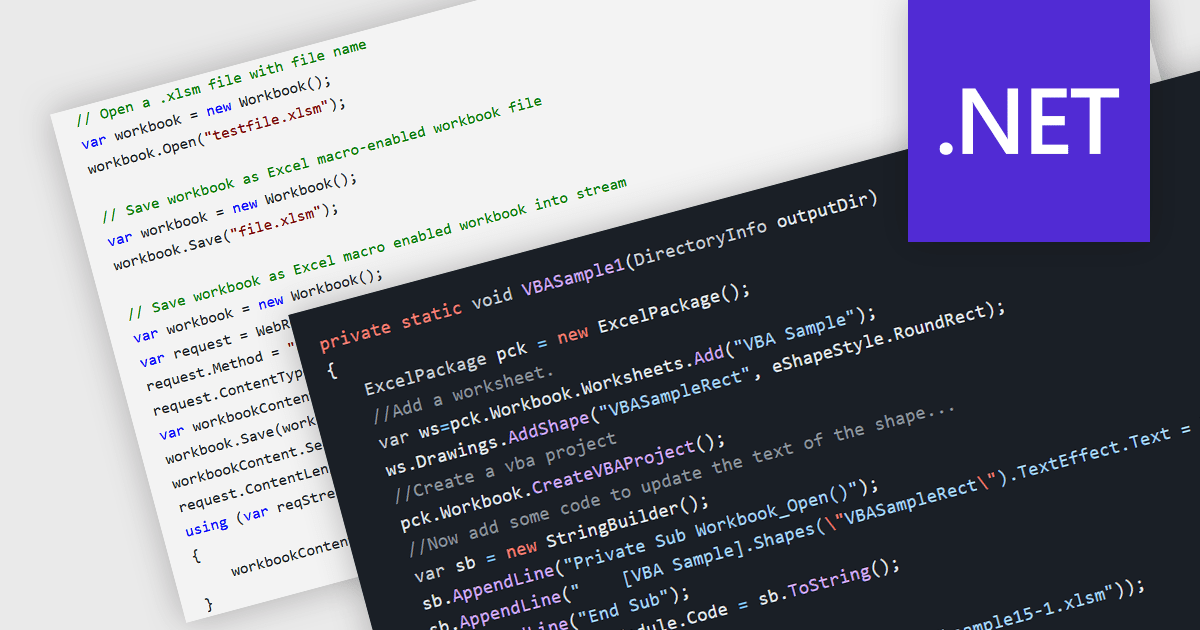
.NET spreadsheet components with VBA code and macro support empower developers to integrate existing Excel automation functionalities within their applications. This unlocks the benefits of the .NET framework, enhancing performance, security, and scalability of spreadsheet operations. Developers can access, modify, and save embedded VBA scripts, ensuring seamless operation in environments that support VBA execution. This fosters continued automation and functionality even when legacy systems or non-VBA-enabled environments are involved, while also enabling code updates, debugging, and preparation for code-execution-friendly settings.
Several .NET spreadsheet components offer VBA code/macro support, including:
For an in-depth analysis of features and price, visit our comparison of .NET spreadsheet components.
DevExpress VCL Subscription is a comprehensive suite for Delphi and C++ Builder developers that includes high-performance UI components, reporting tools, data visualization elements, and application templates. It lets you build rich, data-driven business applications with ease, offering ongoing updates, technical support, and royalty-free distribution rights, perfect for boosting developer productivity and delivering polished software experiences.
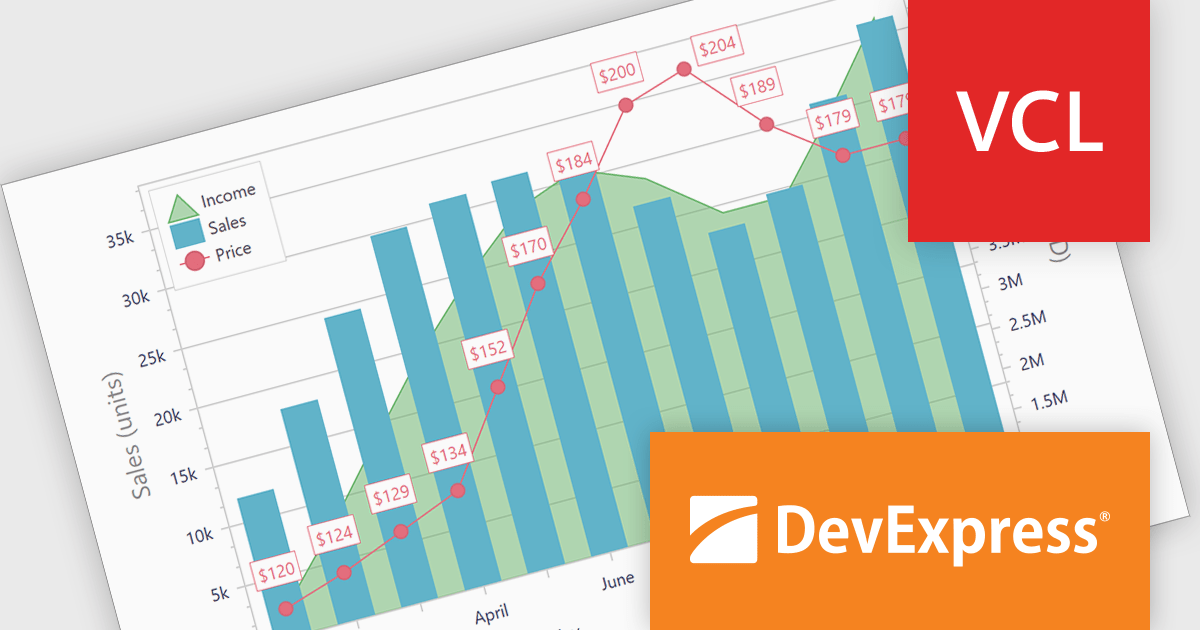
The DevExpress VCL Subscription 24.1 chart control adds support for secondary axes. This innovative feature allows you to overlay an additional Y axis on your chart. This means you can plot data measured in, for example, temperature (degrees Celsius) alongside values in percentage. Each axis has its own scale and labels, keeping your chart clear and avoiding the need to convert units or create separate charts. This is particularly useful for comparing data sets that would otherwise be difficult to display on a single scale.
To see a full list of what's new in version 24.1, see our release notes.
DevExpress VCL Subscription is licensed per developer and is available as a Perpetual License with a 12 month support and maintenance subscription. See our DevExpress VCL Subscription licensing page for full details.
For more information, visit our DevExpress VCL Subscription product page.
聯繫電話: (888) 850 9911
傳真: +1 770 250 6199


