


官方供應商
我們作為官方授權經銷商,直接提供超過200家開發廠家所發行超過1000個的產品授權給您。
請參閱我們所有的品牌。
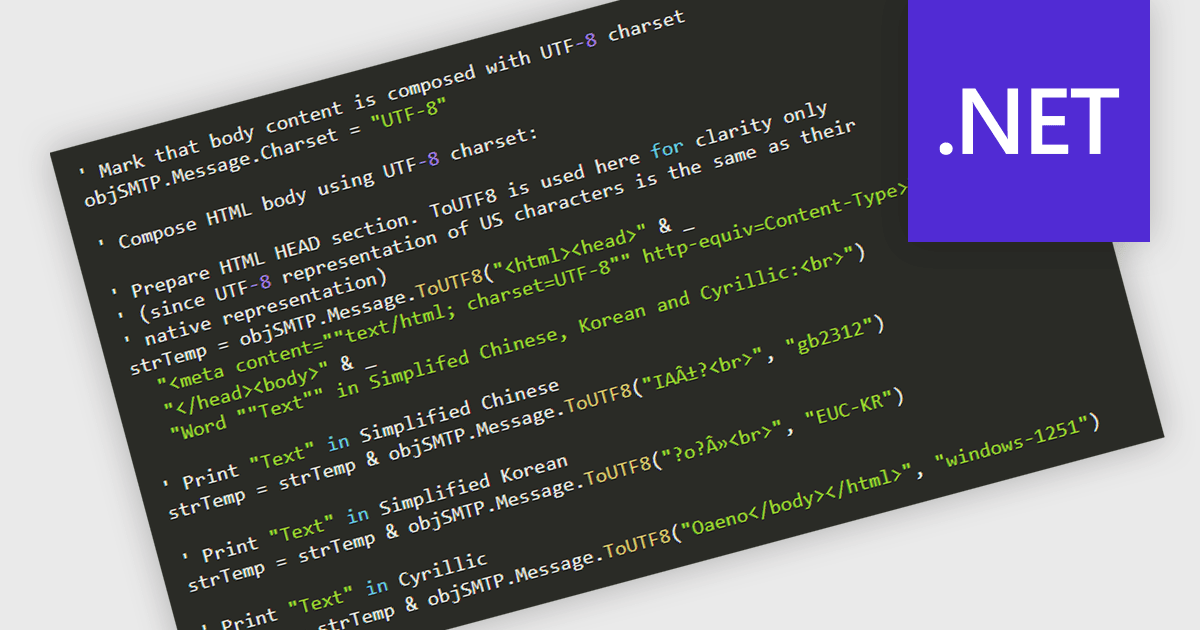
International Character Sets support in .NET communications controls refers to the ability of networking and messaging components to correctly transmit, receive, and process text data encoded in various global character standards, such as Unicode, UTF-8, UTF-16, and legacy code pages. This capability ensures that applications can reliably handle multilingual content, including non-Latin scripts, accented characters, symbols, and right-to-left languages, without data corruption or misinterpretation during serialization, transport, or display. By supporting standardized encoding mechanisms, .NET communications controls allow developers to build globally compatible services, APIs, email clients, and messaging systems that maintain text integrity across different platforms, operating systems, and regional settings, which is essential for modern distributed and internationalized applications.
Several .NET communications and messaging components offer support for international character sets including:
For an in-depth analysis of features and price, visit our comparison of .NET Comms & Messaging components.

Image-to-PDF conversion transforms one or more image files into a single, standardized PDF document, maintaining image quality and consistent layout. Converting images to PDF improves accessibility across devices and platforms, simplifies sharing and printing, and helps organize multiple images into one professional file. It also supports features such as compression and security, making documents easier to store and protect. Common use cases include compiling scanned documents or receipts, creating reports from images, and sharing visual records in a reliable, universally supported format.
Several .NET PDF components allow you to convert images to PDF, including:
For an in-depth analysis of features and price, visit our comparison of PDF components for .NET.
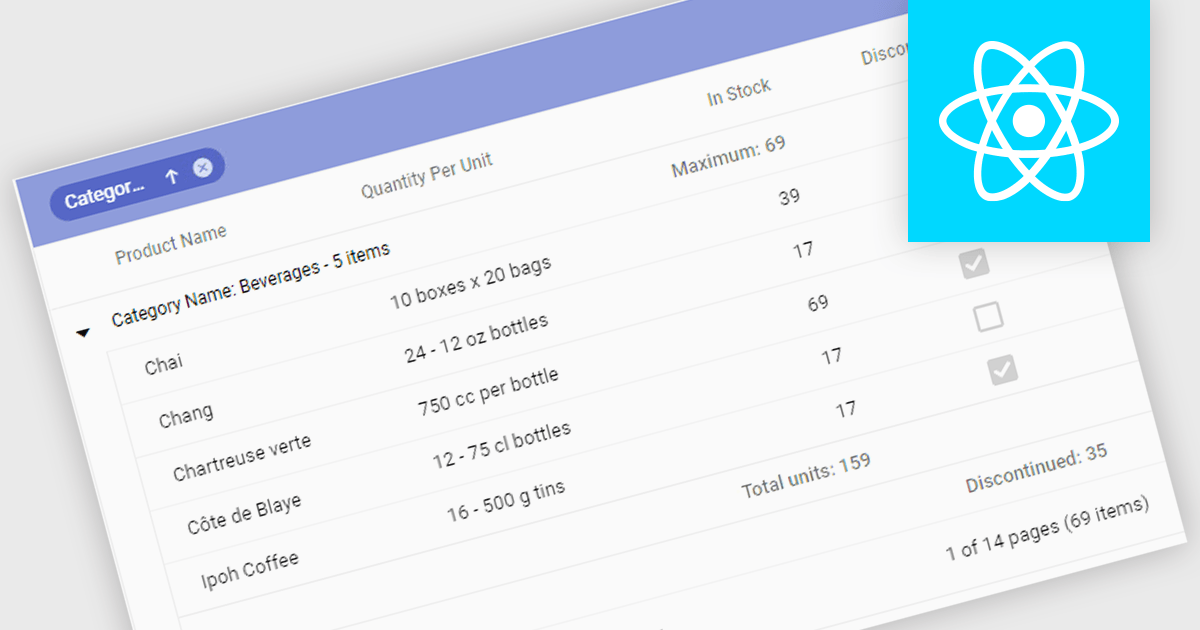
Aggregation in grids is the ability to automatically calculate summary values such as sums, averages, minimums, and maximums directly within tabular data views. By displaying these calculations alongside the underlying data, users can quickly understand trends, compare values, and identify outliers. This enables faster, more informed decision making. Typical use cases include showing total sales figures, calculating average performance metrics, tracking minimum and maximum thresholds, and summarizing financial, operational, or analytical data in real time within business applications.
Several React grid controls offer aggregation including:
For an in-depth analysis of features and price, visit our React grid controls comparison.
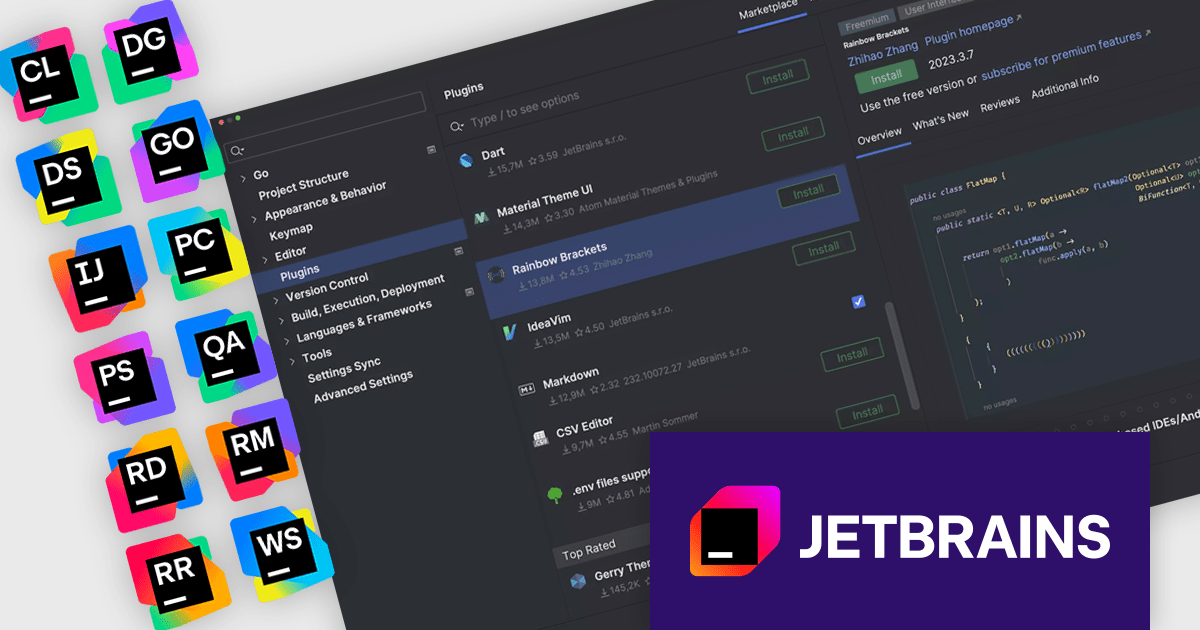
The JetBrains All Products Pack provides access to a comprehensive suite of JetBrains tools, including 12 IDEs, 3 extensions, and 2 profilers, all under one unified license. This flexible solution allows users to switch between tools across multiple machines, adapting to different projects with ease. With a single license, you benefit from simplified license management and significant cost savings - 12 IDEs for the price of two. The All Products Pack is designed to advance your skills by giving you unlimited access to industry-leading professional tools, empowering efficient, high-quality development across a variety of languages and platforms.
The JetBrains All Products Pack provides access to a vibrant plugin ecosystem that enables developers to extend and customize their IDEs to meet specific project requirements. Through a wide selection of official and community-built plugins, it supports additional languages, frameworks, integrations, and productivity tools beyond the default feature set. This flexibility allows teams to standardize tooling across multiple JetBrains IDEs, integrate essential services such as version control and CI/CD platforms, and continuously adapt their development environment as technologies and project demands evolve.
JetBrains All Products Pack is licensed per user as a commercial annual subscription. We can supply new subscriptions, subscription renewals, lapsed subscription renewals, and additional developer licenses. See our JetBrains All Products Pack licensing page for full details.
For more information, see our JetBrains All Products Pack product page.
ActiveReportsJS is a powerful, lightweight reporting tool designed to integrate advanced reporting capabilities into any JavaScript application. ActiveReportsJS enables developers to create, view, export, and print richly formatted reports entirely on the client side - with zero server dependencies.
In this blog post, MESCIUS Product Engineer Sergey Abakumoff shows you how to integrate ActiveReportsJS, a 100% client-side JavaScript reporting tool with zero server dependencies, into a Java web application. Following his steps you will learn how to:
Detailed sample code is included to help you along.
Read the full blog to get started adding rich reporting capabilities to your Java web applications.
ActiveReportsJS is licensed on an annual subscription or perpetual basis and is available as a Single Deployment License for non-commercial use, and as a Single Domain License or Unlimited Domain License for commercial and/or SaaS use. See our ActiveReportsJS licensing page for full details.
For more information, visit our ActiveReportsJS product page.
聯繫電話: (888) 850 9911
傳真: +1 770 250 6199


