PowerCharts V3.2 released

Adds automatic rendering of JavaScript charts on devices that do not support the Flash player, such as iPad and iPhone.
6月 17, 2011
特別功能發表

PowerCharts is a set of advanced charting widgets for usage in specialized applications like network diagrams, performance analysis, hierarchical structures, stock prices and financial planning. Render charts in both Flash and JavaScript (HTML5); works with PCs, Macs, iPads, iPhones and a majority of other mobile devices. PowerCharts integrates with any server-side technology (ASP.NET, PHP, ASP, RoR, JSP, ColdFusion etc.) and database providing highly interactive capabilities like visually editing data, adding data nodes at runtime and submitting modified data back to the server.

Updates in V3.2

  • Automatic rendering of JavaScript charts on devices (like iPad and iPhone) where Flash player is not supported
  • New Error Scatter chart type
  • New Error Line chart type
  • New Heat map chart type
  • New Box and whisker chart type
  • New Multi-series Step line chart type
  • Support for JSON data format
  • Drag-node chart now provides run time addition and deletion of nodes and connectors
  • Drag-node chart now allows to add text labels at run time or from the XML or JSON data
  • Support for LinkedCharts, where a single data source controls multiple charts
  • Interactive legends in charts that allow for selective showing/hiding of data series (or slicing, in case of pie charts)
  • Legends now support icons for each data series
  • Better management of labels on charts. Labels now have an auto rendering mode to prevent them from overlapping, the chart selects the best display mode for labels depending on the length of the labels and the width of the chart. Long labels are truncated, with ellipses appended to the truncated end of each label, and a tooltip bearing the completed label text is displayed when the user hovers over a truncated label
  • Support for line breaks and wrapping in all text elements including: caption, sub caption, X-axis title, Y-axis title, Labels and tooltips
  • In Line charts, data values can now be positioned either above or below the dataplots. Automatic positioning of data values is also supported
  • Custom alignment of caption and sub caption using STYLES
  • Advanced print management using JavaScript
  • Additional options for efficient event handling using JavaScript
  • Support for dynamic update of chart properties using JavaScript
  • Charts now support % based sizes along with dynamic resizing apart from Select Scatter, Drag Node, Drag Column, Drag Line, Drag Area charts

About InfoSoft Global

InfoSoft Global Pvt. Ltd. is a leading provider of Web applications and services, and a part of InfoSoft group which has 20 years experience in Information Technology. InfoSoft Global has identified Adobe Flash based Web applications as its focus area. The company believes that Adobe Flash is a breakthrough in delivering effective experiences to end users, enabling rich Internet applications that blend content, application logic and communications.
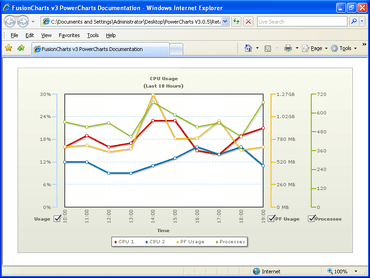
Multi-axis Line Chart with interactive axis in PowerCharts.

PowerCharts XT

先進的 JavaScript (HTML5) 專業圖表集。

有任何疑問嗎?

Live Chat現在與我們的FusionCharts 專家即時聊天詢問。