構件 / Vizuly / CFXWorks - 最暢銷的
Create highly customized and unique data visualizations.
Scatter Plot Chart - Shows three dimensions of data at once by plotting values along both the X and Y axis as well as the radius of the plot itself. Each plot can be colored and styled dynamically based on your data.
-
描述:
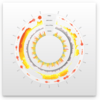
A radial line and area layout visualization. Vizuly Corona is a radial chart that provides angular and curved radial area line curves and supports both an overlap and stacked layout. It also features over a dozen different dynamic styles and comes bundled ...
閱讀詳情
顯示關於這個產品的更多結果
-
描述:
徑向線條和區域佈局視覺化。 Vizuly Corona is a radial chart that provides angular and curved radial area line curves and supports both an overlap and stacked layout. It also features over a dozen different dynamic styles and comes bundled with an easy to use test ...
閱讀詳情
-
描述:
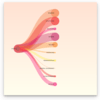
Represent asymmetric hierarchical information in an easy to read visualization. Vizuly Weighted Tree nodes and branches can be dynamically sized and styled based on data bound properties that you set. One challenge with large hierarchal tree structures is ...
閱讀詳情
顯示關於這個產品的更多結果
-
描述:
在易於閱讀的視覺化中表示非對稱分層資訊。 Vizuly Weighted Tree nodes and branches can be dynamically sized and styled based on data bound properties that you set. One challenge with large hierarchal tree structures is being able to easily navigate the tree when many branches ...
閱讀詳情
-
描述:
Represent transactional relationships from a specified number of sources to a variable number of targets. Vizuly Halo uses several different data visualization techniques to represent transactional relationships from a specified number of sources to a ...
閱讀詳情
顯示關於這個產品的更多結果
-
描述:
將來自指定數量的源的事務關係表示為可變數量的目標。 Vizuly Halo uses several different data visualization techniques to represent transactional relationships from a specified number of sources to a variable number of targets. Sources are represented as segmented arcs along the ...
閱讀詳情
-
描述:
Represent cartesian x/y data within a radial plot. Vizuly Radial Bar is designed to represent cartesian x/y data within a radial plot. It supports both clustered and stacked radial bars Use the interactive style explorer on the left to view different ...
閱讀詳情
顯示關於這個產品的更多結果
-
描述:
在徑向圖中表示笛卡爾式 x/y 資料。 Vizuly Radial Bar is designed to represent cartesian x/y data within a radial plot. It supports both clustered and stacked radial bars Use the interactive style explorer on the left to view different style settings, themes, and other ...
閱讀詳情
-
描述:
Easily display multi-variate time series information. Vizuly Ring Chart lets you easily display multi-variate time series information. Due to its radial form factor, you can display 3 times the information for a given screen width than you could with a ...
閱讀詳情
顯示關於這個產品的更多結果
-
描述:
輕鬆顯示多變數時間序列資訊。 Vizuly Ring Chart lets you easily display multi-variate time series information. Due to its radial form factor, you can display 3 times the information for a given screen width than you could with a more traditional cartesian layout. You ...
閱讀詳情
-
描述:
Add stacked and clustered bar charts to your JavaScript apps. Vizuly Bar Chart supports both stacked and clustered layout options, as well as over 2 dozen different dynamic styles. It also comes bundled with a test container and examples of different ...
閱讀詳情
顯示關於這個產品的更多結果
-
描述:
將堆疊和群集橫條圖添加到您的 JavaScript 應用中。 Vizuly Bar Chart supports both stacked and clustered layout options, as well as over 2 dozen different dynamic styles. It also comes bundled with a test container and examples of different style based themes. You can use ...
閱讀詳情
-
描述:
Add stacked and clustered column charts to your JavaScript apps. Vizuly Column Chart supports both stacked and clustered layout options, as well as over 2 dozen different dynamic styles. It also comes bundled with a test container and examples of ...
閱讀詳情
顯示關於這個產品的更多結果
-
描述:
將堆疊和群集的直條圖添加到您的 JavaScript 應用中。 Vizuly Column Chart supports both stacked and clustered layout options, as well as over 2 dozen different dynamic styles. It also comes bundled with a test container and examples of different style based themes. You can use ...
閱讀詳情
-
描述:
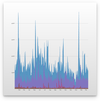
Add line and area charts to your JavaScript apps. Vizuly Line Area Chart supports both line and area plots in several different layout options. It also comes bundled with a test container demonstrating the various chart properties and different style ...
閱讀詳情
顯示關於這個產品的更多結果
-
描述:
將線條和麵積圖添加到您的 JavaScript 應用中。 Vizuly Line Area Chart supports both line and area plots in several different layout options. It also comes bundled with a test container demonstrating the various chart properties and different style themes. You can either ...
閱讀詳情
-
描述:
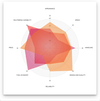
Add Radar charts to your JavaScript apps. Vizuly Radar Chart graphs multiple dimensions of one datum along multiple radial axis. Each plot represents 3 or more data points along shared axis lines. This chart supports highlighting of both individual data ...
閱讀詳情
顯示關於這個產品的更多結果
-
描述:
將雷達圖表添加到您的 JavaScript 應用中。 Vizuly Radar Chart graphs multiple dimensions of one datum along multiple radial axis. Each plot represents 3 or more data points along shared axis lines. This chart supports highlighting of both individual data points and the ...
閱讀詳情
-
描述:
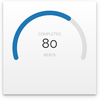
Show numeric values within a minimum and maximum range. Vizuly Radial Progress is designed to show numeric values within a minimum and maximum range. It can also show when a value has exceeded the maximum threshold. This chart supports a variable range of ...
閱讀詳情
顯示關於這個產品的更多結果
-
描述:
在最小和最大範圍內顯示數值。 Vizuly Radial Progress is designed to show numeric values within a minimum and maximum range. It can also show when a value has exceeded the maximum threshold. This chart supports a variable range of start/stop angles, arc end caps, and ...
閱讀詳情


