


官方供應商
我們作為官方授權經銷商,直接提供超過200家開發廠家所發行超過1000個的產品授權給您。
請參閱我們所有的品牌。
繼續用英語閱讀:
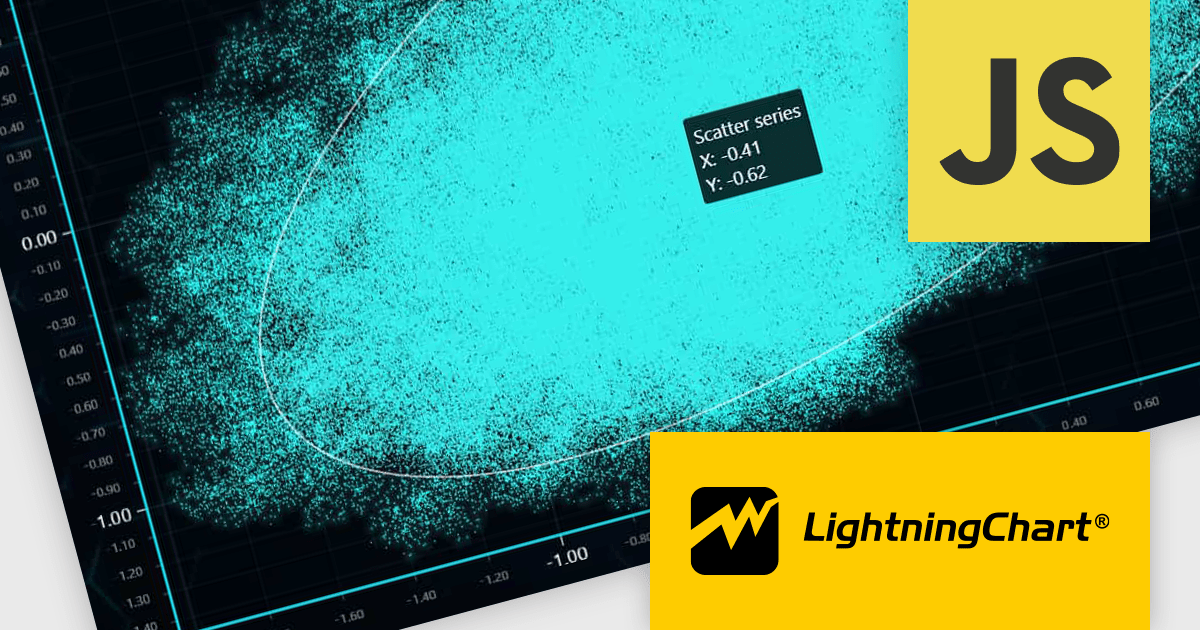
LightningChart JS is a high-performance JavaScript charting library optimized for real-time data visualization. Leveraging WebGL and GPU acceleration, it enables developers to create interactive, complex charts capable of handling massive datasets with high refresh rates. Ideal for applications demanding rapid data updates and smooth interactions, LightningChart JS provides a robust API for customization and integration into web-based projects.
The LightningChart JS v6.0.0 update introduces enhanced cursor capabilities, providing developers with greater control over cursor behavior and appearance. New features include custom cursor shapes, dynamic cursor updates based on data points, and precise cursor positioning, allowing for more informative and interactive visualizations. These improvements facilitate the creation of tailored user experiences and enable developers to effectively convey complex data insights through intuitive cursor interactions.
LightningChart JS v6.0.0 cursor improvements include:
To see a full list of what's new in v6.0.0, see our release notes.
LightningChart JS is licensed based on method of deployment with options including SaaS Developer Licenses, Application Developer Licenses, and Publisher Developer Licenses. Each license is perpetual and includes 1 year subscription for technical support and software updates. See our LightningChart JS licensing page for full details.
Learn more on our LightningChart JS product page.
聯繫電話: (888) 850 9911
傳真: +1 770 250 6199


