
LightningChart JS
快如閃電、互動和回應的 2D 和 3D JavaScript 圖表。
由以下開發商製作:LightningChart
ComponentSource 開始代理銷售的日期:2021年
快如閃電、互動和回應的 2D 和 3D JavaScript 圖表。
由以下開發商製作:LightningChart
ComponentSource 開始代理銷售的日期:2021年

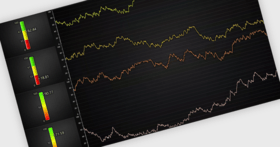
LightningChart JS is a WebGL-based, GPU accelerated and cross-platform charting library that has been developed to deliver outstanding performance for the most demanding data-driven applications. Performance is up to 10M+ of data points in real-time. LightningChart's charting library combines incredible speed with sturdy load capacity. Optimized for demanding industries like engineering, healthcare engineering and medical devices, industrial process control, and scientific use. LightningChart JS includes several framework application development templates for technologies such as iOS, Android, React, Vue JS, ASP.NET, Blazor, Xamarin and more.


圖像1/5
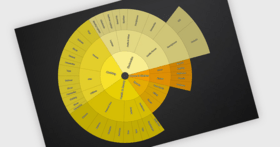
LightningChart JS Offers an Intuitive User Experience LightningChart JS charting library is an advanced data visualization solution for web applications development providing UI touchscreen interactions, a high DPI rendering support, legend boxes, server-side rendering, fluid animations and currently, a visualization capacity of 10 million data points in real-time.


Live Chat現在與我們的LightningChart 專家即時聊天詢問。


聯繫電話: (888) 850 9911
傳真: +1 770 250 6199


