













官方供應商
我們作為官方授權經銷商,直接提供超過200家開發廠家所發行超過1000個的產品授權給您。
請參閱我們所有的品牌。
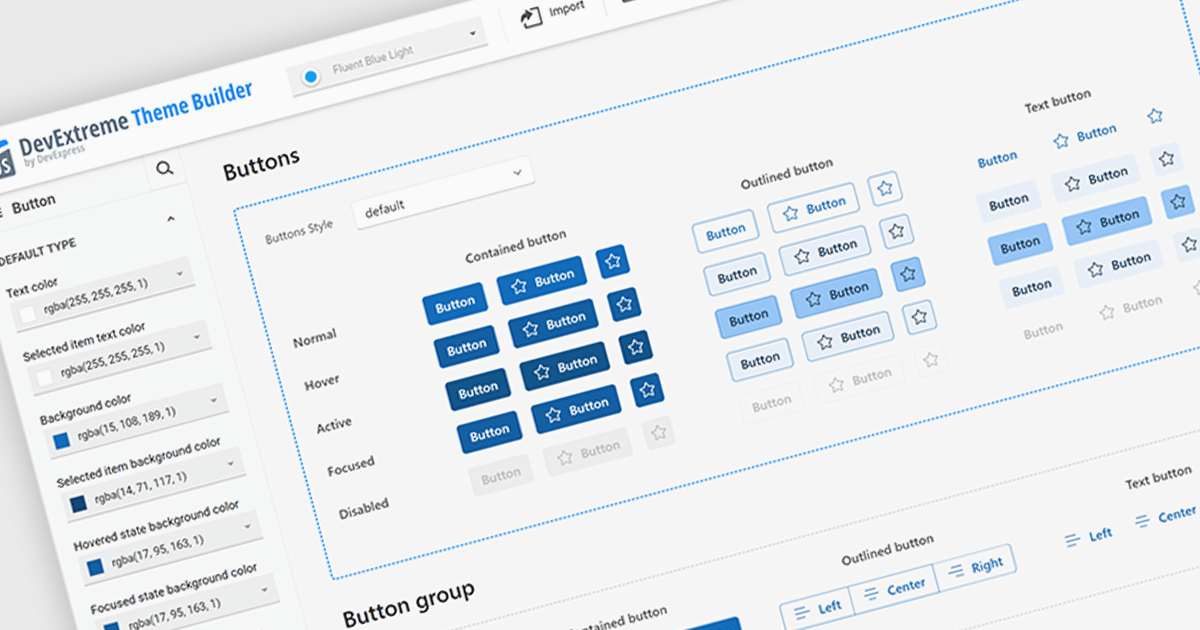
Theming support in UI component suites refers to the capability to define and apply consistent visual styles, such as colors, typography, spacing, and component appearances across an entire application. It typically allows developers to customize or switch themes dynamically, enabling alignment with branding requirements or user preferences without modifying core component logic. This separation of styling from functionality improves maintainability, reduces duplication, and accelerates development by promoting reuse, while also supporting scalability as design systems evolve and new themes are introduced.
Several Angular UI suites offer theming including:
For an in-depth analysis of features and price, visit our Angular UI suites comparison.
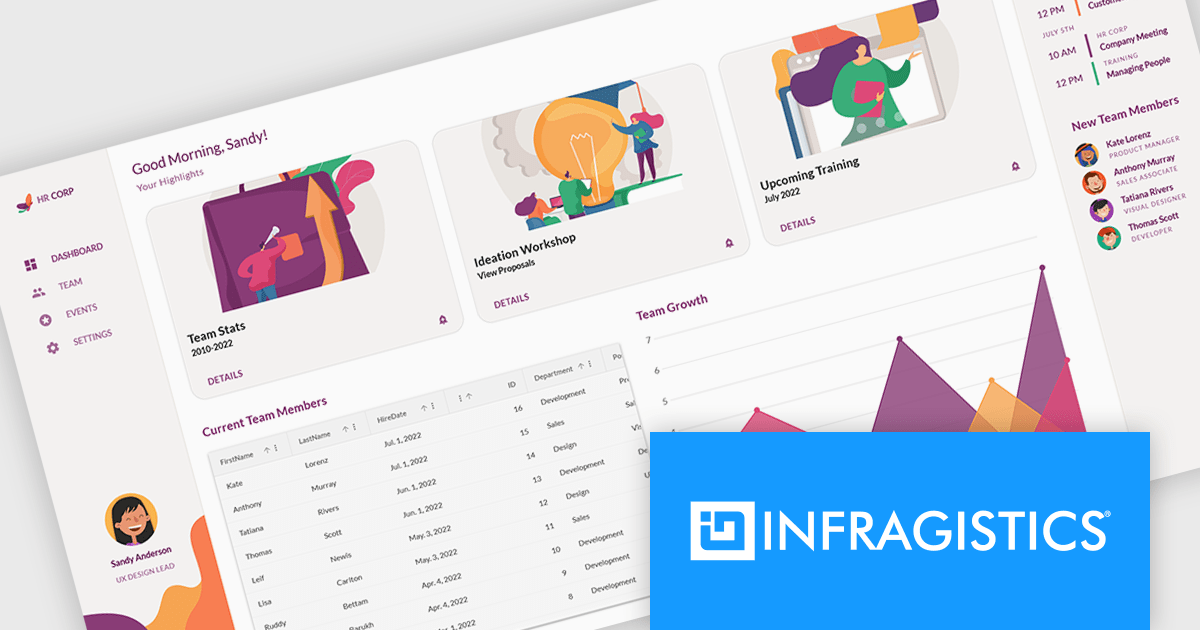
Infragistics Ignite UI is a collection of user interface components, frameworks, and development tools designed to help developers build modern web applications. It includes ready-to-use elements such as data grids, charts, and layout components for frameworks like Angular and React, along with tooling to simplify project setup and configuration. The focus is on handling complex data-heavy interfaces efficiently while maintaining performance, accessibility, and a consistent user experience across applications.
The Ignite UI CLI release includes a new Model Context Protocol (MCP) server that exposes documentation, API references, and scaffolding to tools like GitHub Copilot, Cursor and JetBrains AI Assistant. There is also support for generating code from images, making it easier to move from design to implementation. Angular templates have been refreshed, React templates expanded, and older project types removed to keep the setup process more focused.
Infragistics Ignite UI is licensed per developer and is available as a Perpetual License with a 1, 2 or 3 year support and maintenance subscription. See our Infragistics Ignite UI licensing page for full details.
Infragistics Ignite UI is available in the following products:
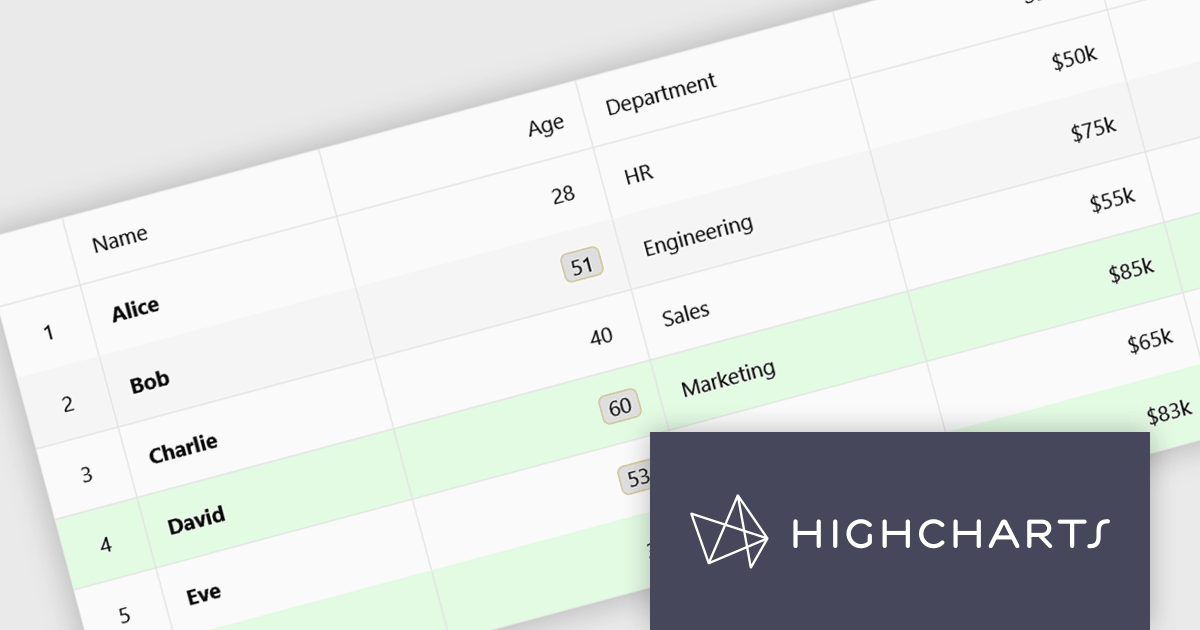
Highcharts Grid Pro is a versatile data grid component developed by the creators of Highcharts, offering both standalone functionality and tight integration within the Highcharts and Highcharts Dashboards ecosystems. It features advanced capabilities such as real-time data binding, column sorting, filtering, inline editing, pagination, and data export, enabling users to work with structured data efficiently. Features include:
Highcharts Grid Pro is licensed per developer as an Annual or Perpetual License with Internal, Saas, SaaS+ and OEM distribution options. The annual license includes support and all product updates for 1 year and must be renewed to continue to use the software. The perpetual license includes an "Advantage Subscription" which provides support and updates for a set period of time. If you do not renew Advantage then you may continue to use the software at the last release available during the active Advantage period. See our Highcharts Grid Pro licensing page for full details.
Learn more on our Highcharts Grid Pro product page.
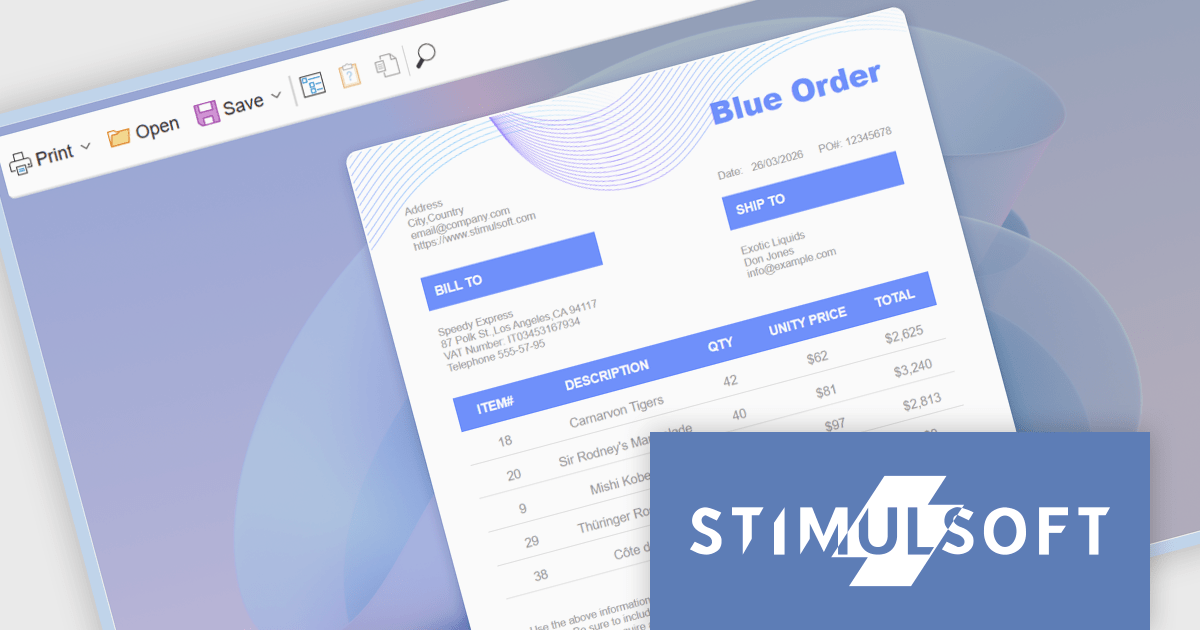
Stimulsoft Reports.WEB is a cross-platform reporting solution designed for integration within web applications. It leverages a client-server architecture for report generation, viewing, printing, and exporting directly in web browsers. Its powerful .NET report engine offers efficient report processing, a user-friendly HTML5 report designer for building reports with various data sources and visualizations, and an interactive HTML5 viewer for seamless report display within web applications. This integration allows developers to implement robust reporting functionalities without browser plugins or additional client-side dependencies.
The Stimulsoft Reports.WEB 2026.2 update introduces a native React Viewer component that allows developers to embed report viewing and interaction directly within React applications using standard npm and NuGet packages. This approach simplifies integration and deployment by aligning with familiar tooling and workflows, while the clear separation between client-side and server-side components supports scalable architecture and easier maintenance. It also enhances performance through efficient client-side rendering and provides a consistent way to deliver interactive reporting functionality within modern web development environments.
To see a full list of what's new in 2026.2, see our release notes.
Stimulsoft Reports.WEB is licensed per developer and is available as a perpetual license with 1 year support and maintenance. See our Stimulsoft Reports.WEB licensing page for full details.
Stimulsoft Reports.WEB is available individually or as part of Stimulsoft Ultimate.
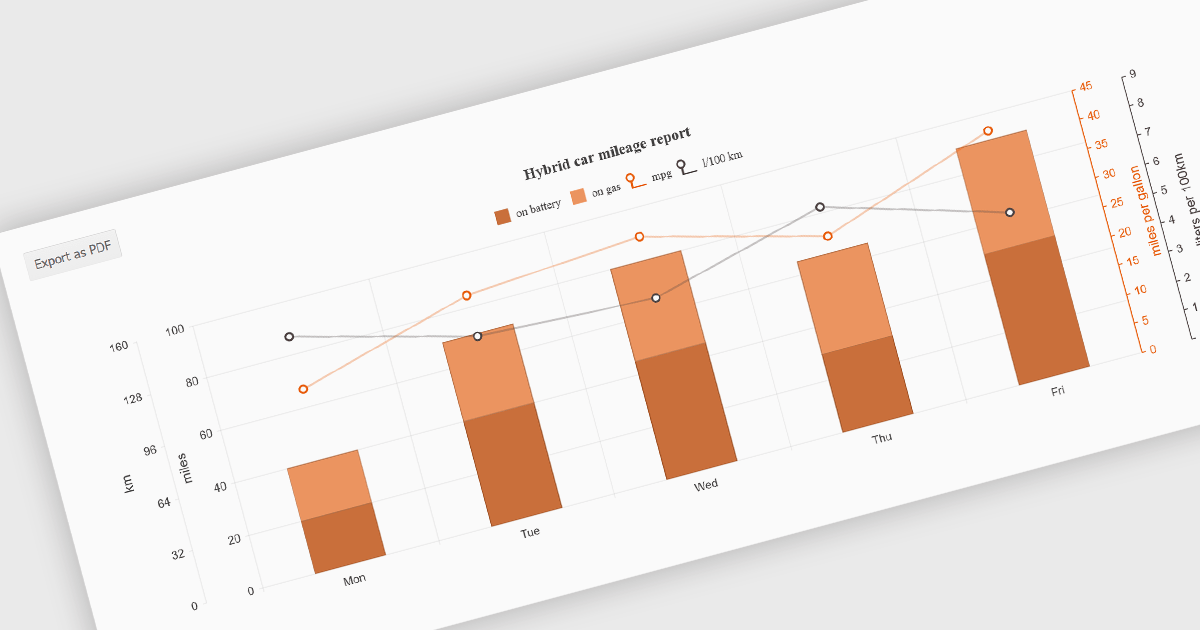
Exporting charts to PDF involves generating a static, portable document version of a chart that preserves its visual structure and data representation. This capability is valuable for reporting, compliance, and sharing insights in a consistent format that does not depend on a live application or browser environment. It allows teams to distribute visual data in a widely accepted file format, ensures layout stability across devices, and supports archival or print-ready use cases without requiring additional tooling.
Several jQuery chart components allow you to export to PDF, including:
For an in-depth analysis of features and price, visit our comparison of jQuery chart components.
聯繫電話: (888) 850 9911
傳真: +1 770 250 6199


