


官方供應商
我們作為官方授權經銷商,直接提供超過200家開發廠家所發行超過1000個的產品授權給您。
請參閱我們所有的品牌。
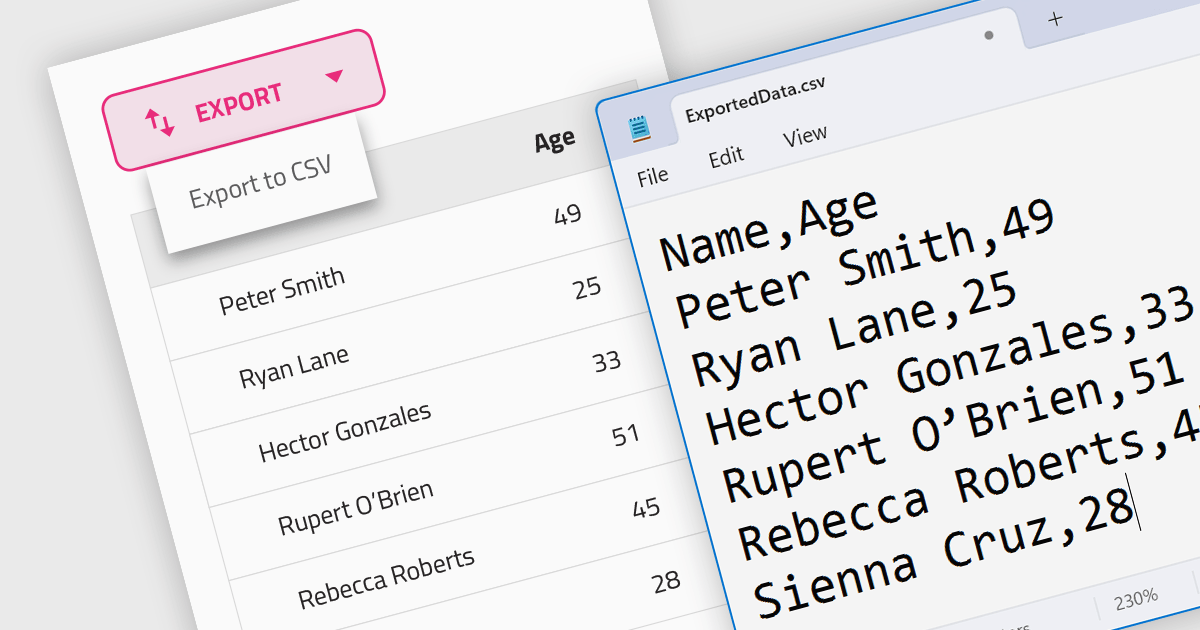
CSV export functionality in a grid control empowers users to seamlessly bridge the gap between interactive visualization and in-depth analysis. By exporting the displayed data as a readily importable CSV file, users gain immediate access to a familiar format compatible with diverse spreadsheet tools. This feature promotes efficient data extraction, facilitating further analysis, report generation, and data sharing, all directly from the convenience of the grid interface.
Several Angular grid controls support exporting to CSV, such as:
For an in-depth analysis of features and price, visit our Angular grid controls comparison.
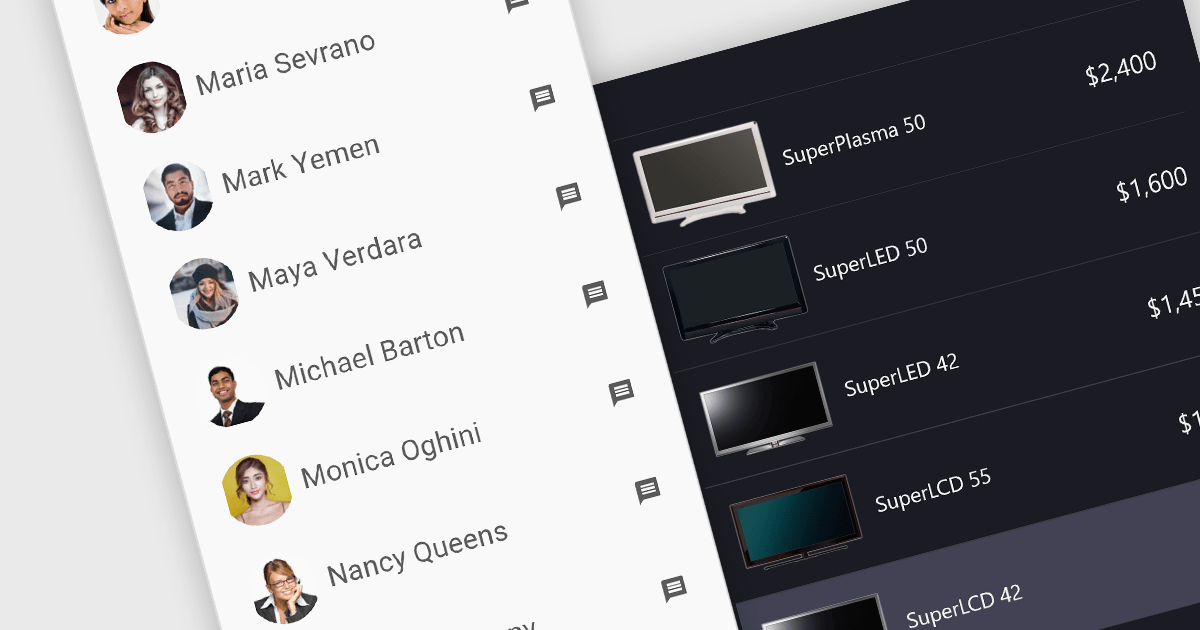
Image listboxes transcend the limitations of traditional listboxes by incorporating image previews alongside textual labels. This creates an intuitive browsing experience, enabling users to quickly identify and select an option with visual cues. This is particularly useful for applications where visual selection enhances the user experience, such as choosing products in an e-commerce platform or selecting avatars in user profiles. It combines the clarity of images with the efficiency of a listbox to streamline selection processes.
Several JavaScript data editor collections provide image listbox capabilities including:
For an in-depth analysis of features and price, visit our comparison of JavaScript Data Editor components.
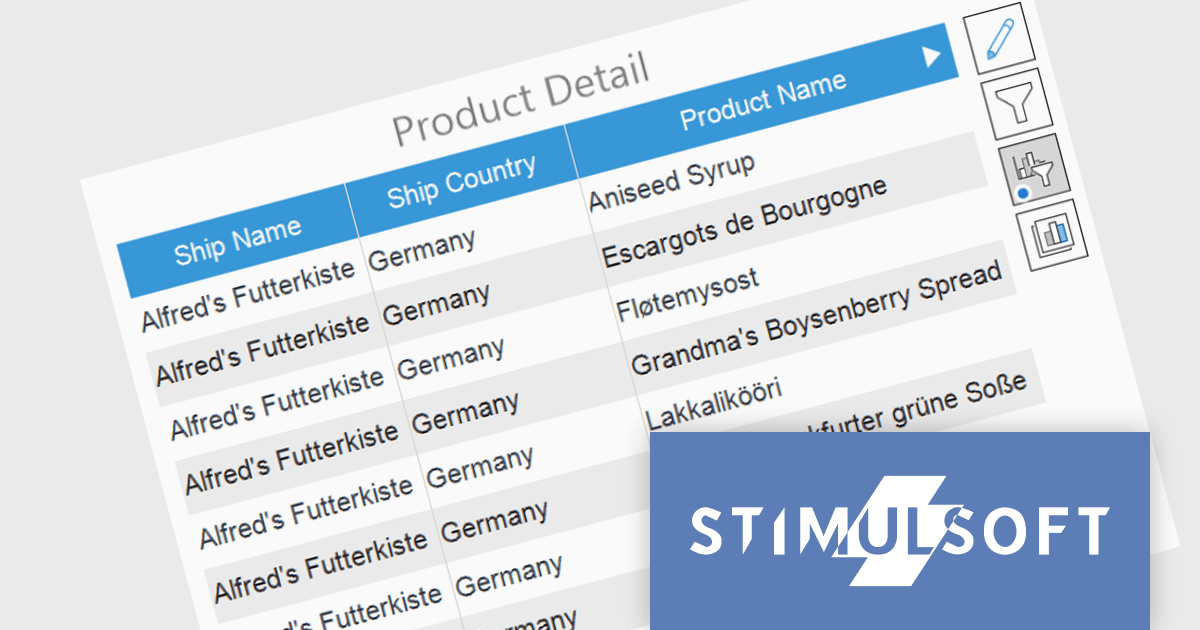
Stimulsoft Dashboards is a versatile suite of tools for crafting interactive data visualizations for web and desktop applications. It empowers developers to embed intuitive dashboards across various platforms, including .NET, JavaScript, and PHP, using the platform-specific components or a centralized cloud designer. With rich data analysis elements, extensive customization options, and pre-built templates, Stimulsoft Dashboards helps you transform complex data into clear, actionable insights for any audience.
The Stimulsoft Dashboards 2024.1.1 update adds the option to include custom filters for the Table element in dashboards. When filters are applied to the table, a dedicated control element lets you easily edit and remove user filters with a single click. This intuitive addition streamlines workflow, keeps you focused, and ensures your dashboards always reflect the exact insights you need.
To see a full list of what's new in version 2024.1.1, see our release notes.
Stimulsoft Ultimate is licensed per developer and is available as a Perpetual license with 1 year support and maintenance. See our Stimulsoft Ultimate licensing page for full details.
Stimulsoft Dashboards is available to buy in the following products:
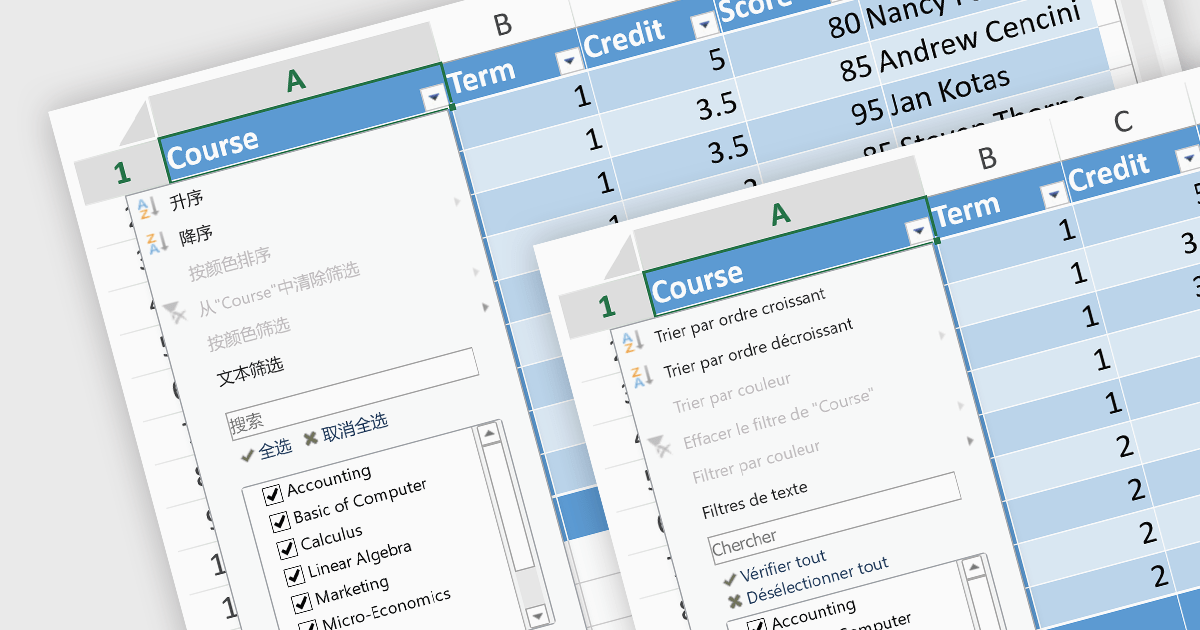
In spreadsheet controls, localization refers to adapting the user interface and functionality to different languages and cultural contexts. This involves translating static text like menu labels and buttons, formatting dates and numbers according to regional conventions, and even adjusting features like formula syntax to match users' expectations. Effective localization ensures intuitive interaction for global audiences, boosting user adoption and enhancing the overall spreadsheet experience.
Several Angular spreadsheet controls support localization including:
For an in-depth analysis of features and price, visit our Angular Spreadsheet Controls comparison.

MDBootstrap Pro Angular (MDB Pro Angular) is a UI component library that combines Material Design aesthetics with the Bootstrap and Angular frameworks. It empowers developers to craft visually appealing and interactive web applications with ease, offering an extensive collection of pre-built components like modals, charts, carousels, and data tables. Tailored for professional projects, it unlocks advanced features like dark mode theming, advanced form controls, and integrated charting libraries, all while adhering to industry-leading coding standards and comprehensive documentation for a smooth development experience.
MDB Pro Angular v6.0.0 adds support for Angular 17, which boasts a game-changing application builder for dramatically faster build times, a streamlined control flow syntax for enhanced developer productivity, and an optimized lazy loading system with Deferrable views that enable both declarative and deferred loading for improved initial rendering speeds. This powerful combination empowers developers to craft even more robust and performant web applications with greater ease.
To see a full list of what's new in version 6.0.0, see our release notes.
MDB Pro Angular is licensed per developer, per project/domain with packages for individual developers, development teams and Enterprises. See our MDB Pro Angular licensing page for full details.
For more information, visit our MDB Pro Angular product page.
聯繫電話: (888) 850 9911
傳真: +1 770 250 6199


