


官方供應商
我們作為官方授權經銷商,直接提供超過200家開發廠家所發行超過1000個的產品授權給您。
請參閱我們所有的品牌。
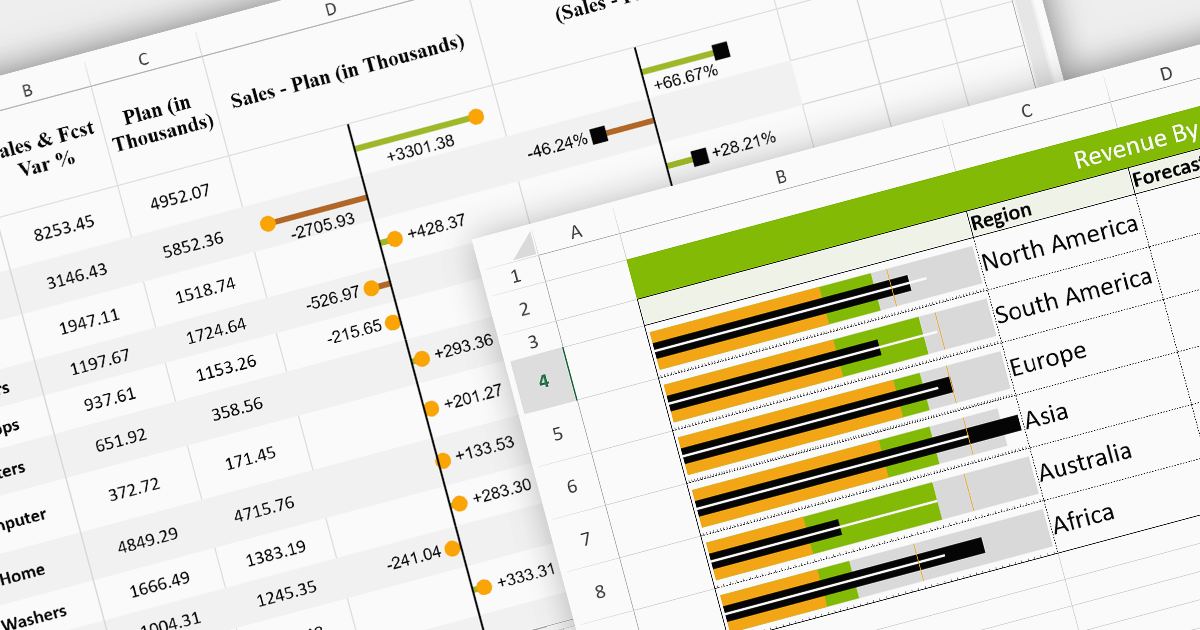
Sparklines are miniature charts embedded within the cells of a spreadsheet. Their compact size allows for dense visualizations, revealing trends and patterns in large datasets without sacrificing valuable screen space. Placed directly beside their corresponding data, they facilitate immediate comparisons and insights, enhancing understanding and communication. Their flexible nature allows for diverse chart types, from lines highlighting trends to columns showcasing comparisons, making them adaptable to various data presentations.
Here are some React spreadsheet controls that offer sparkline functionality:
For an in-depth analysis of features and price, visit our comparison of React spreadsheet controls.
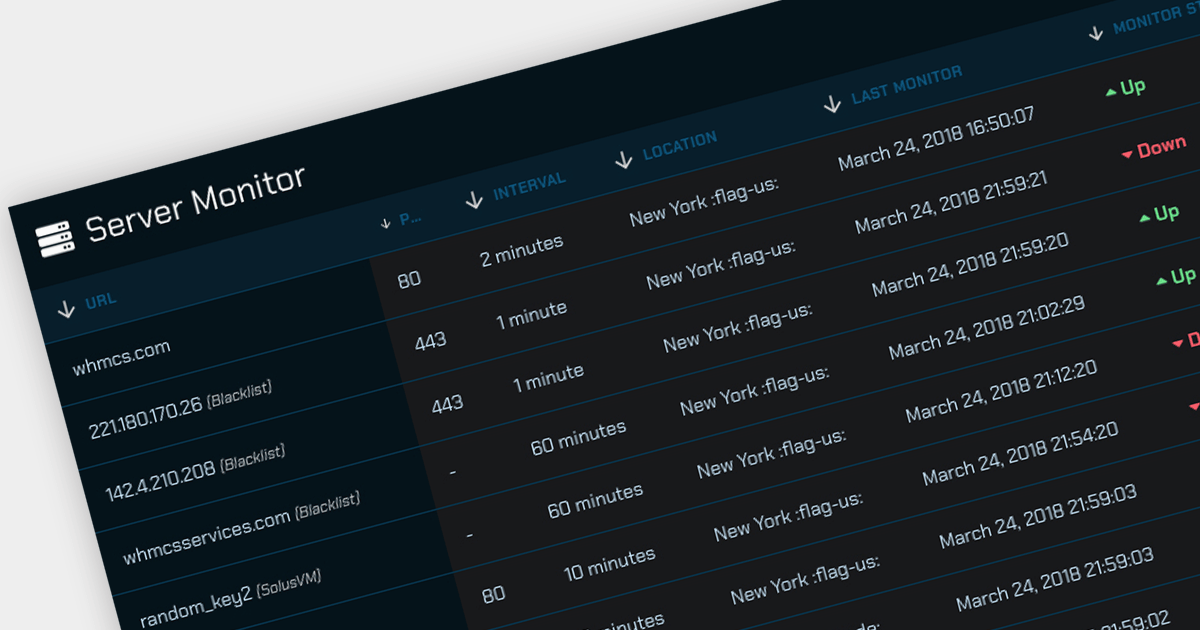
Offloading sorting tasks to a server (known as remote server sorting or server-side sorting) enables large datasets to be handled efficiently without overwhelming the client. This minimizes data transmission and leads to snappier web applications. Moreover, server-side sorting boosts scalability by ensuring processing happens on the server, freeing up client resources. This translates to faster response times, especially for large datasets, making the user experience smoother. This approach empowers developers to build responsive and scalable web applications that excel at managing and presenting sorted data.
Several Angular grid controls offer sorting on the remote server, including:
For an in-depth analysis of features and price, visit our comparison of Angular Grid controls.
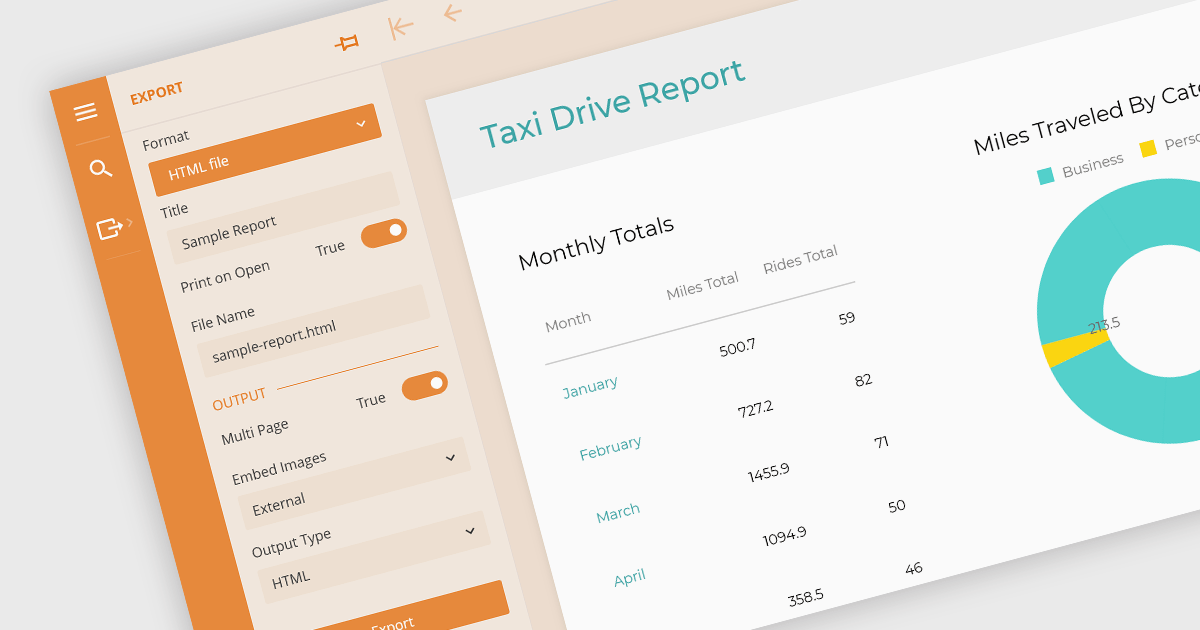
Being able to export to HTML is a valuable feature of a reporting application. Exporting reports to HTML files involves converting data visualizations and analytical summaries from a native format into web-friendly HTML pages. This allows for wider accessibility, sharing, and potentially embedding reports within websites. Static reports are transformed into interactive documents easily viewable on any device with a web browser. This format is ideal for sharing reports with collaborators, posting them online, or simply ensuring they remain accessible even if the original software becomes unavailable.
These Vue.js report components allow you to export reports to HTML files:
For an in-depth analysis of features and price, visit our comparison of Vue.js Reporting components.
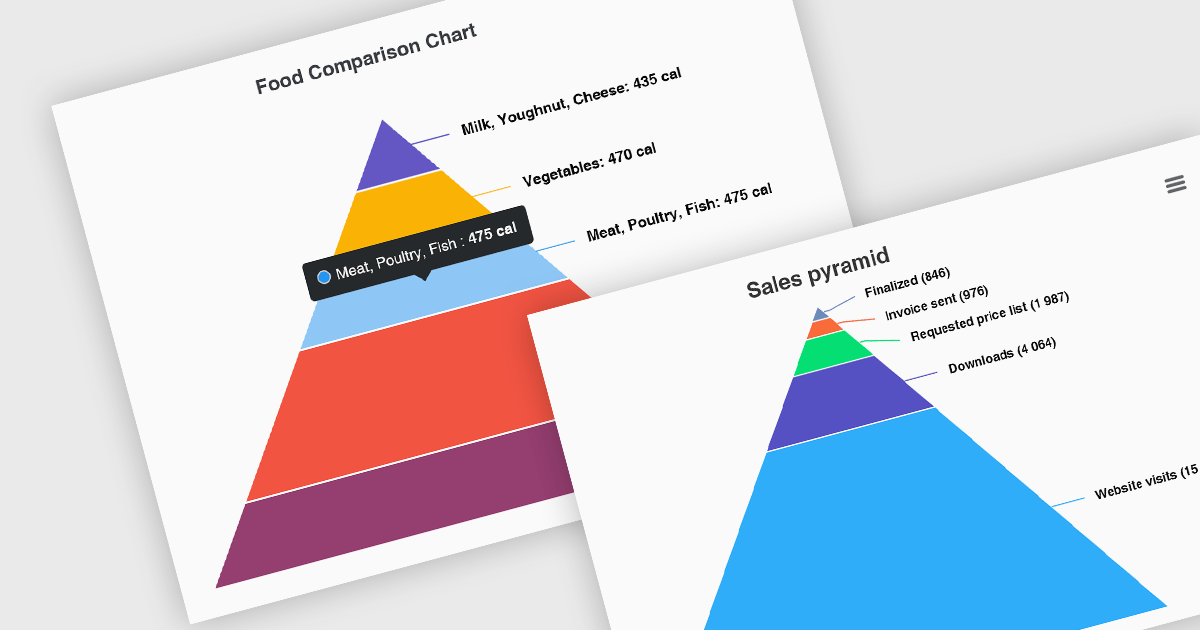
Pyramid charts, also known as triangle diagrams, utilize a triangular shape segmented into horizontal sections, each representing a level in a hierarchy, process, or simple dataset. Their strength lies in visually depicting hierarchical relationships, emphasizing the relative importance or size of each level through varying widths. The easily understood layout makes them ideal for communicating clear, singular data points in fields like sales funnels, population structures, and educational concepts.
Several Vue.js chart controls offer pyramid charts including:
For an in-depth analysis of features and price, visit our Vue.js chart controls comparison.

Red Carpet Subscription by /n software is an all-inclusive package offering developers access to its entire library of development tools. This includes communication and security libraries for various protocols and platforms, network management tools, enterprise adapters, and any new products released during the subscription period.
Red Carpet Subscription Vol. 1 2024 adds IPWorks VoIP, empowering you to seamlessly manage inbound and outbound calls, host audio conferences, incorporate pre-recorded audio, and even leverage text-to-speech functionalities. Its seamless integration with Session Initiation Protocol (SIP), Session Description Protocol (SDP), and Real-time Transport Protocol (RTP) guarantees streamlined communication establishment and maintenance. The included IPPhone component allows you to construct a software-based phone replicating the functionality of traditional handsets. Design customized Interactive Voice Response (IVR) menus using the IVR component, facilitating automation and granting complete control over design and menu customization.
To see a full list of what's new in Red Carpet Subscription Vol. 1 2024, see our release notes.
Red Carpet Subscription is licensed per developer and is available as a Perpetual License with a 12 month support and maintenance subscription. See our Red Carpet Subscription licensing page for full details.
For more information, visit our /n software Red Carpet Subscription product page.
聯繫電話: (888) 850 9911
傳真: +1 770 250 6199


