













官方供應商
我們作為官方授權經銷商,直接提供超過200家開發廠家所發行超過1000個的產品授權給您。
請參閱我們所有的品牌。
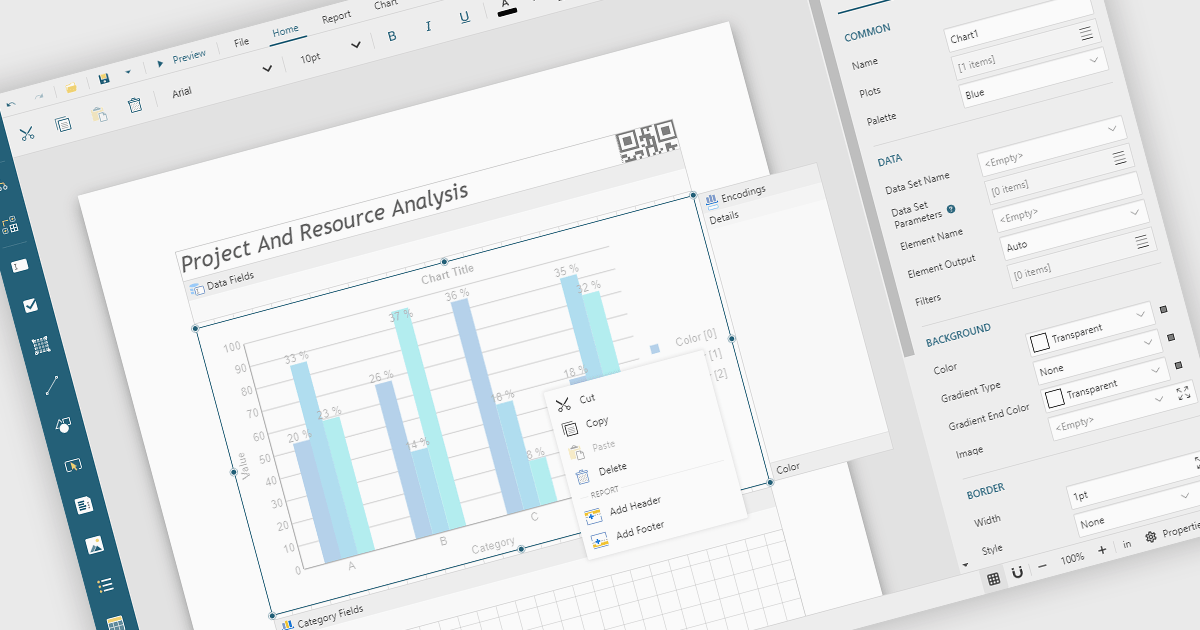
A Visual Report Designer is an application that enables users to create interactive, analytical, and print-ready reports using an intuitive, drag-and-drop interface. It supports fully customizable templates and data visualization components, helping teams present complex information clearly while maintaining consistent branding and layouts. Typical use cases include executive dashboards, financial and operational reports, customer analytics summaries, compliance documents, and branded client-facing reports.
Several JavaScript reporting components offer visual report designers including:
For an in-depth analysis of features and price, visit our JavaScript reporting comparison.

SpreadJS is a complete enterprise JavaScript spreadsheet solution used to create financial reports and dashboards, budgeting and forecasting models, scientific, engineering, healthcare, education, science lab notebooks, and other similar JavaScript business applications. It leverages a high-speed calculation engine with over 500 Excel built-in functions in 19 languages to deliver true Excel-like spreadsheet experiences with zero dependencies on Excel and full support for React, Vue, Angular, and TypeScript.
On Thursday, February 26th at 11:00 AM EST, MESCIUS (formerly GrapeCity) will be presenting a CodeClinic Live Webinar highlighting the new Collaboration Server as a production-ready solution for real-time, multi-user spreadsheet editing in enterprise JavaScript applications. During this webinar, SpreadJS Product Manager Chris Bannon and Product Marketing Manager Mackenzie Albitz will take you through the following key takeaways:
Register for the Live Webinar today and mark your calendar for February 26th.
SpreadJS is licensed per developer and includes 1 Year Maintenance (major and minor version releases and unlimited support phone calls). SpreadJS requires an Annual or Perpetual Deployment License. The optional Add-ons are available at an additional cost, and require a SpreadJS license. See our SpreadJS licensing page for full details.
For more information, visit our SpreadJS product page.
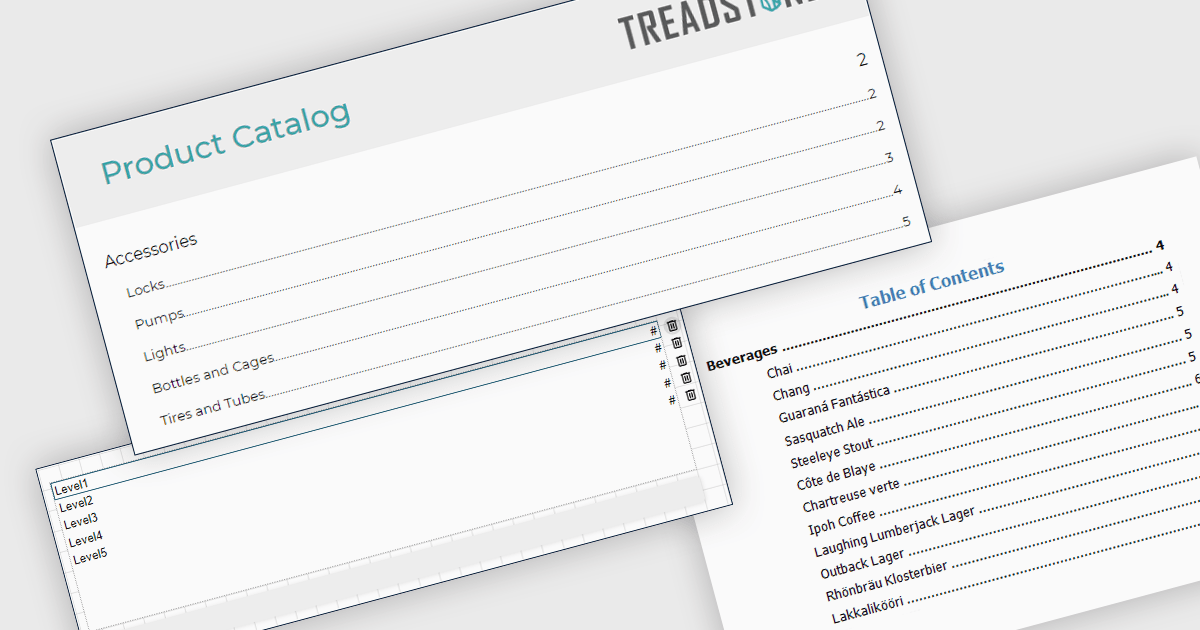
A table of contents in a report is a structured list of sections and subsections that provides an organized overview of the document's content. It typically reflects the report's hierarchy and allows readers to navigate quickly to specific sections, either through page references in printed formats or clickable links in digital formats. This functionality improves usability by reducing the time required to locate information, supporting clearer document structure, and making complex or lengthy reports easier to understand and manage. For organizations that distribute detailed analytical or operational reports, a table of contents contributes to a more professional presentation and a more efficient review process.
Several JavaScript reporting components allow you to add a table of contents, including:
For an in-depth analysis of features and price, visit our comparison of JavaScript reporting components.
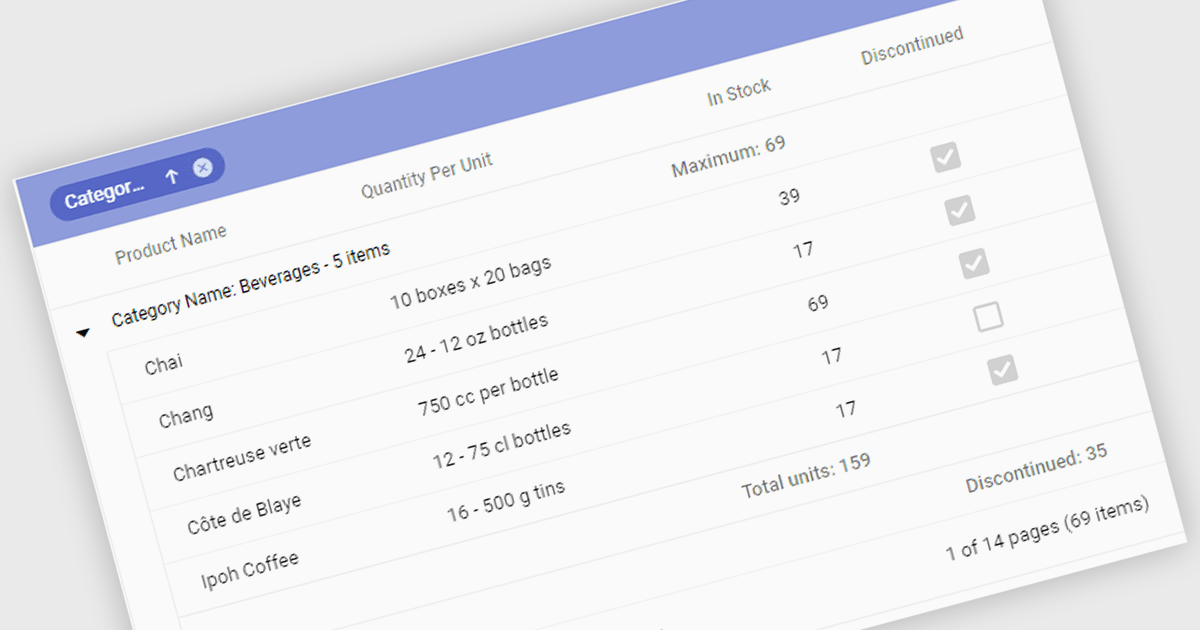
Aggregation in grids is the ability to automatically calculate summary values such as sums, averages, minimums, and maximums directly within tabular data views. By displaying these calculations alongside the underlying data, users can quickly understand trends, compare values, and identify outliers. This enables faster, more informed decision making. Typical use cases include showing total sales figures, calculating average performance metrics, tracking minimum and maximum thresholds, and summarizing financial, operational, or analytical data in real time within business applications.
Several React grid controls offer aggregation including:
For an in-depth analysis of features and price, visit our React grid controls comparison.
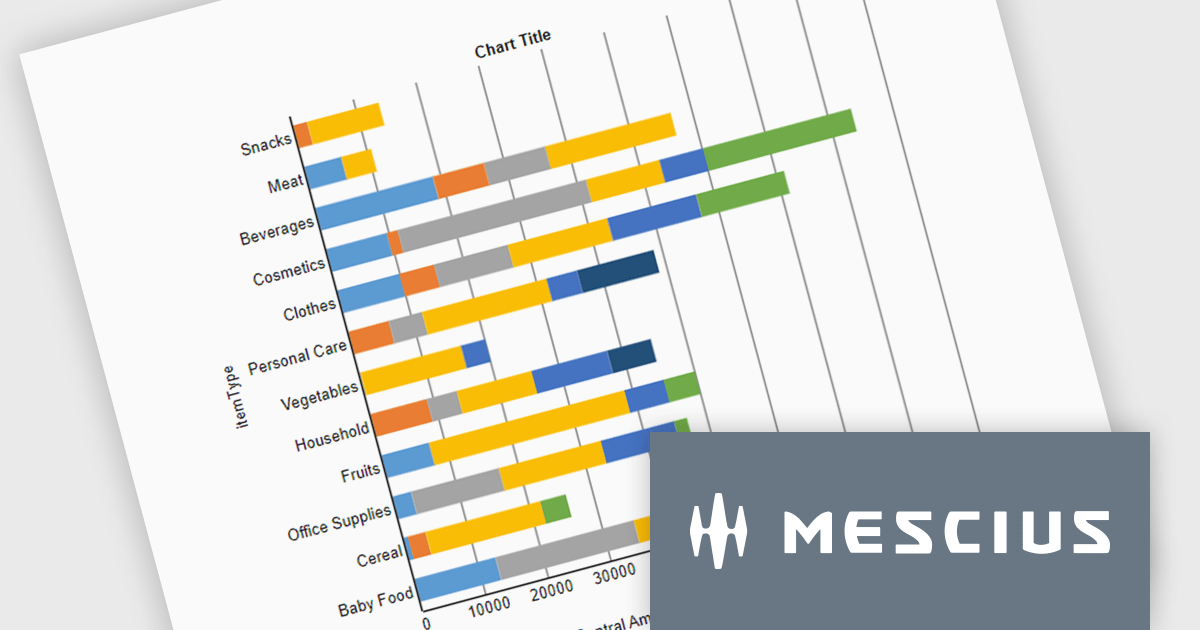
ActiveReportsJS is a powerful, lightweight reporting tool designed to integrate advanced reporting capabilities into any JavaScript application. ActiveReportsJS enables developers to create, view, export, and print richly formatted reports entirely on the client side - with zero server dependencies.
In this blog post, MESCIUS Product Engineer Sergey Abakumoff shows you how to integrate ActiveReportsJS, a 100% client-side JavaScript reporting tool with zero server dependencies, into a Java web application. Following his steps you will learn how to:
Detailed sample code is included to help you along.
Read the full blog to get started adding rich reporting capabilities to your Java web applications.
ActiveReportsJS is licensed on an annual subscription or perpetual basis and is available as a Single Deployment License for non-commercial use, and as a Single Domain License or Unlimited Domain License for commercial and/or SaaS use. See our ActiveReportsJS licensing page for full details.
For more information, visit our ActiveReportsJS product page.
聯繫電話: (888) 850 9911
傳真: +1 770 250 6199


