


官方供應商
我們作為官方授權經銷商,直接提供超過200家開發廠家所發行超過1000個的產品授權給您。
請參閱我們所有的品牌。
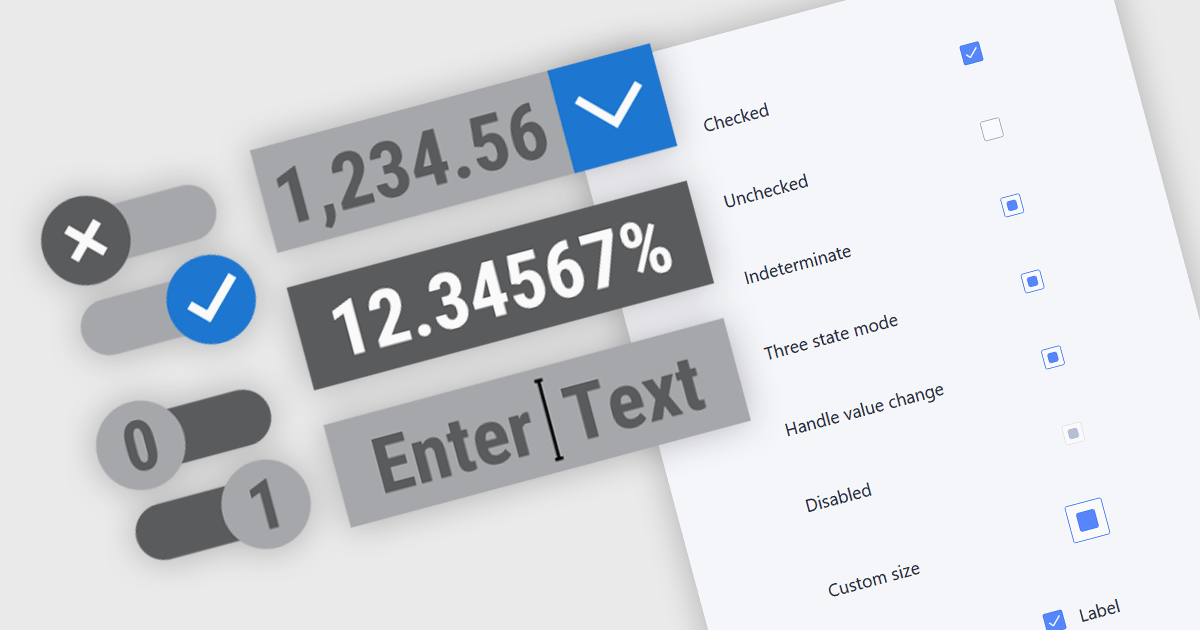
Text, numeric, and boolean data editor components for JavaScript provide the fundamental building blocks for capturing and validating user input in web applications. These editors are designed to handle a wide range of data types and interaction patterns, helping developers present consistent, accessible, and predictable input experiences across forms, grids, and dialogs while integrating cleanly with application logic and data models.
Common editors include:
For an in-depth analysis of features and price, visit our JavaScript data editors comparison.
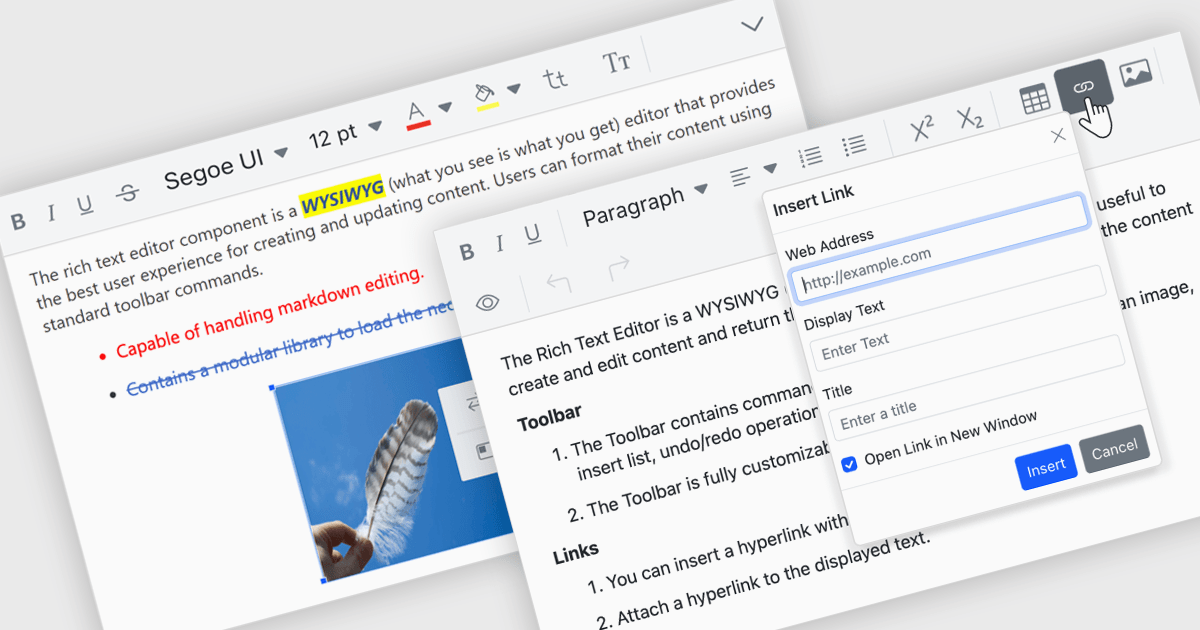
RTF editor support in a data editor component means the component can display, edit, and persist Rich Text Format (RTF) content, allowing users to work with formatted text that includes fonts, styles, alignment, and embedded elements rather than plain text. For software developers, this enables applications to store and manage rich textual data such as notes, descriptions, or documents directly within structured data processes, while relying on a standardized, well-supported format. The result is improved user input quality, consistent formatting across systems, and reduced need for custom text handling logic, while still maintaining compatibility with databases and backend services that expect structured data.
Several JavaScript data editor collections provide RTF editing capabilities including:
For an in-depth analysis of features and price, visit our comparison of JavaScript Data Editor components.
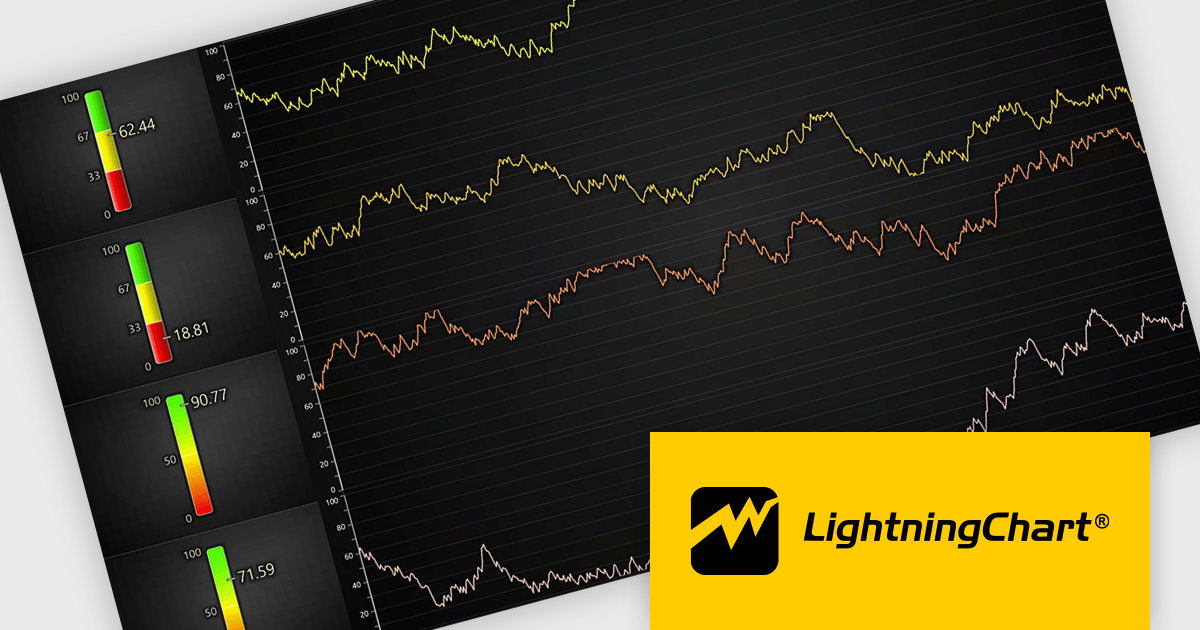
LightningChart JS is a high-performance JavaScript charting library that utilizes WebGL rendering and GPU acceleration to deliver exceptional performance for a wide range of data visualization needs. It is designed to handle large datasets and complex visualizations with ease, enabling developers to create interactive and visually appealing 2D and 3D charts. Ideal for applications demanding smooth real-time data updates, such as financial platforms, engineering tools, scientific research dashboards, and industrial monitoring systems, LightningChart JS provides a comprehensive API for customization and integration into web-based projects.
The LightningChart JS v8.2 update introduces a new Linear Gauge Chart that enables software developers to present real-time metrics in a clear, structured format within modern web applications. It supports continuous live data updates, configurable interpolated or discrete color steps for representing thresholds and ranges, and both vertical and horizontal orientations to accommodate different layout requirements. The chart also allows current values to be displayed directly on the gauge and supports custom icons, giving developers greater control over visual consistency while building intuitive, status-focused dashboards for monitoring and analytics use cases.
To see a full list of what's new in v8.2, see our release notes.
LightningChart JS is licensed per developer and is available as an annual license with 1 year support. See our LightningChart JS licensing page for full details.
For more information, see our LightningChart JS product page.
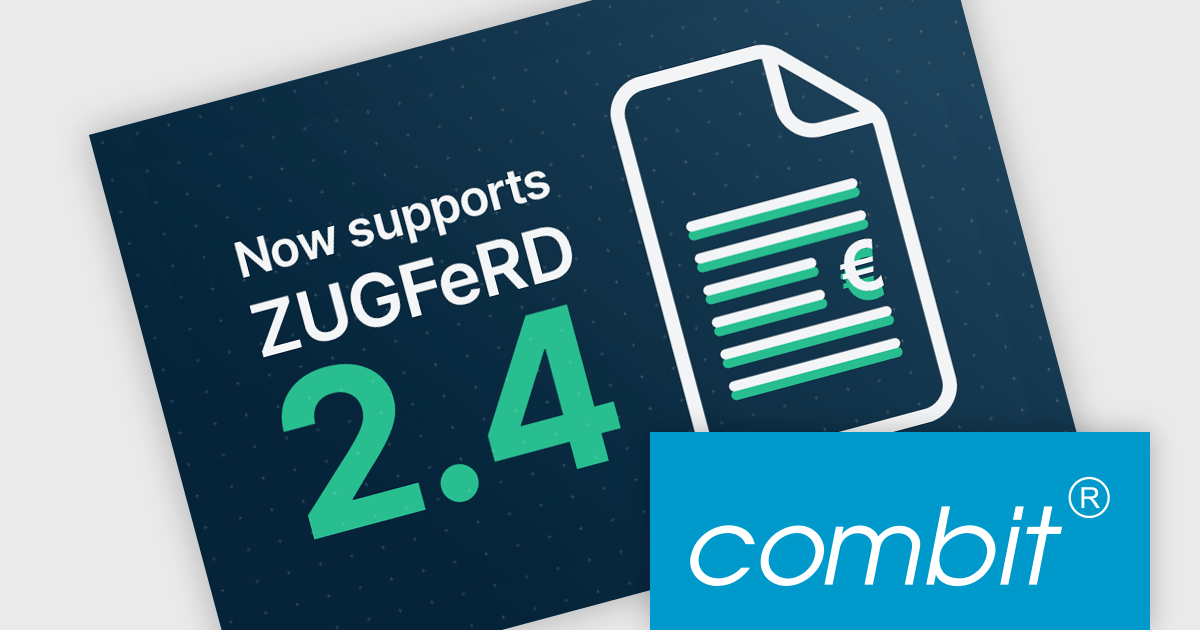
List & Label by combit is a software development toolkit that helps developers to integrate comprehensive reporting functionalities into their desktop, web, and cloud applications. It offers features such as data binding, complex data visualization, and a user-friendly report designer, along with printing, exporting, and previewing capabilities. List & Label operates independently of programming languages and data sources, providing developers with the flexibility to design and deliver informative reports within their development environment.
The List & Label 31.001 update adds support for ZUGFeRD 2.4, enabling standards-compliant electronic invoices to be generated as part of existing reporting and document output processes. Developers can produce invoices that combine a conventional PDF layout with embedded XML data compatible with EN 16931, allowing the same document to be used for both visual review and automated processing. This allows current e-invoicing requirements to be met without introducing separate invoice formats or additional export logic.
To see a full list of what's new in version 31.001, see our release notes.
List & Label is licensed per developer and is available as a Perpetual License with a 12 month support and maintenance subscription. See our List & Label licensing page for full details.
List & Label is available in the following products:
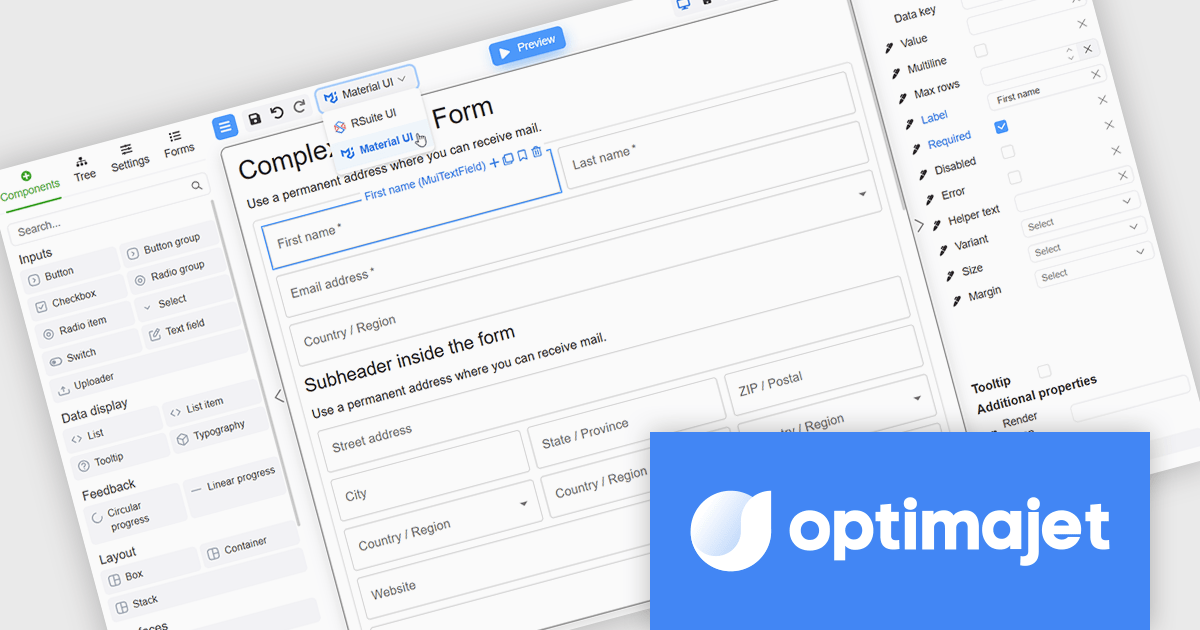
Optimajet FormEngine is a drag-and-drop React form builder that lets teams create, manage, and render complex web forms without writing frontend code. It allows developers and business users to visually design forms, store them as JSON, and render them at runtime. As a React JS library, it easily integrates into existing applications while giving developers full control over form logic, structure, and data flow, making it well suited for complex data collection.
The Optimajet FormEngine v7.10.0 update introduces integration with the Material UI components library, allowing developers to build and render React forms using a widely adopted and actively maintained UI framework. This integration improves form development by reducing reliance on custom components and manual styling, while promoting consistent layout, behavior, and accessibility across applications. By aligning FormEngine with Material UI design patterns, development teams can more easily integrate forms into existing React projects, improve maintainability, and deliver modern user experiences with less effort.
To see a full list of what's new in version v7.10.0, see our release notes.
Optimajet FormEngine is licensed based on usage type (internal commercial use, public web/SaaS, or OEM embedding), number of domains for the visual editor, and access to additional ready-made components. Licenses are perpetual and include 6 months or 1 year of updates and support. See our Optimajet FormEngine licensing page for full details.
For more information, visit our Optimajet FormEngine product page.
聯繫電話: (888) 850 9911
傳真: +1 770 250 6199


