


官方供應商
我們作為官方授權經銷商,直接提供超過200家開發廠家所發行超過1000個的產品授權給您。
請參閱我們所有的品牌。
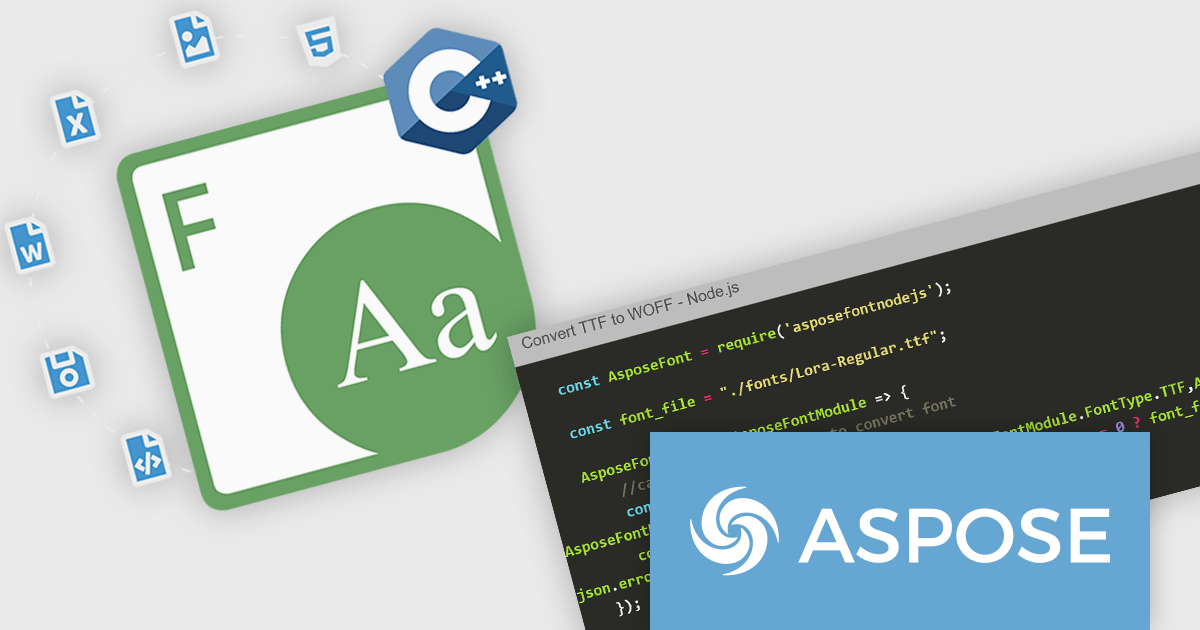
Aspose.Font for Node.js via C++ is a native Node.js library that enables developers to load, manage, and process a wide range of font file formats directly within JavaScript applications. Built on C++ and exposed via WebAssembly, the library supports formats such as TrueType (TTF), OpenType (OTF), Web Open Font Format (WOFF/WOFF2), CFF, EOT, and Type 1 fonts. It provides functionality for reading font metadata, extracting glyphs, rendering individual characters, and converting fonts between formats, all without relying on any external software or font rendering engines.
The library offers clear advantages for applications that require programmatic font manipulation, inspection, or transformation. Developers working on document generation, digital publishing, or font auditing tools can use Aspose.Font to embed, subset, or convert fonts in workflows involving PDF or web content. Its ability to extract font details and render glyphs programmatically also makes it suitable for design automation, compliance checking, or branding systems where consistent typography handling is essential. The self-contained nature of the library ensures cross-platform compatibility and seamless integration into Node.js applications running on server or desktop environments.
Aspose.Font for Node.js via C++ is offered as Developer Small Business, Developer OEM, Developer SDK, Site Small Business, Site OEM and Site SDK licenses catering to a range of business needs. Licenses are perpetual, and include 1 year of support and maintenance. Subscription renewals are also available. See our Aspose.Font for Node.js via C++ licensing page for full details.
Aspose.Font for Node.js via C++ is available individually or as part of the following products:
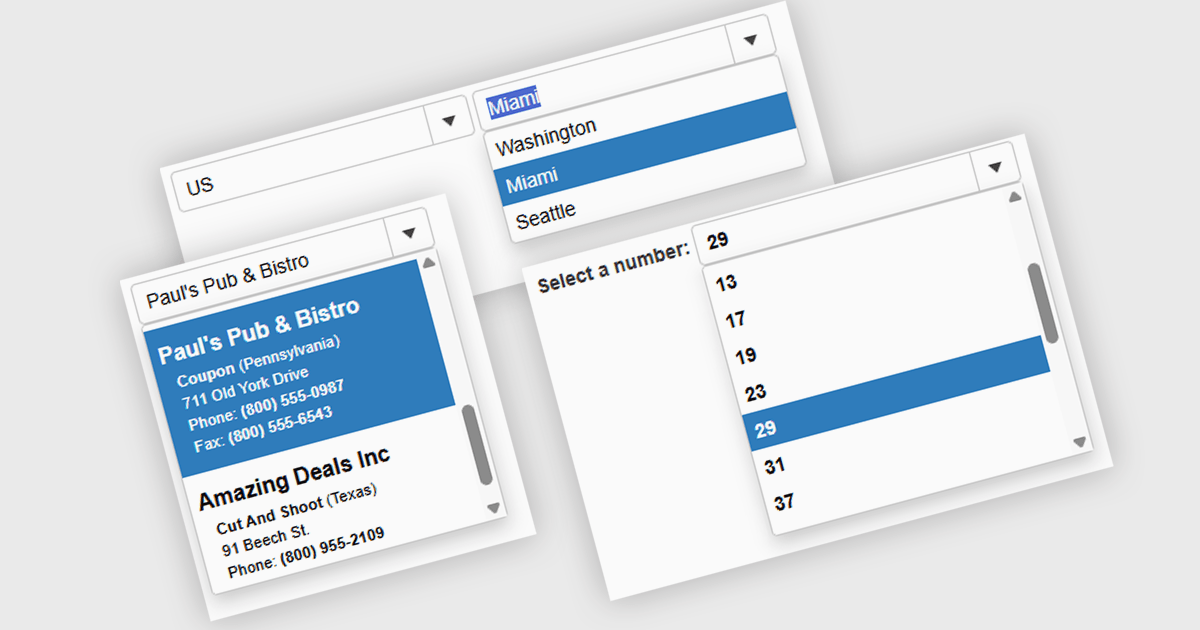
A combobox Web Components control is a user interface element that combines an input field with a dropdown list, allowing users to either type a value directly or select from predefined options. It is commonly used to simplify data entry, particularly when the input must match a set of known values. By supporting features such as filtering, autocomplete, and keyboard navigation, a combobox enhances accessibility and improves the user experience in forms or interactive components. It also helps maintain consistency and validation in data-driven applications by reducing the likelihood of input errors.
Several Web Components Data Editors offer a combobox including:
For an in-depth analysis of features and price, visit our comparison of Web Components Data Editors.
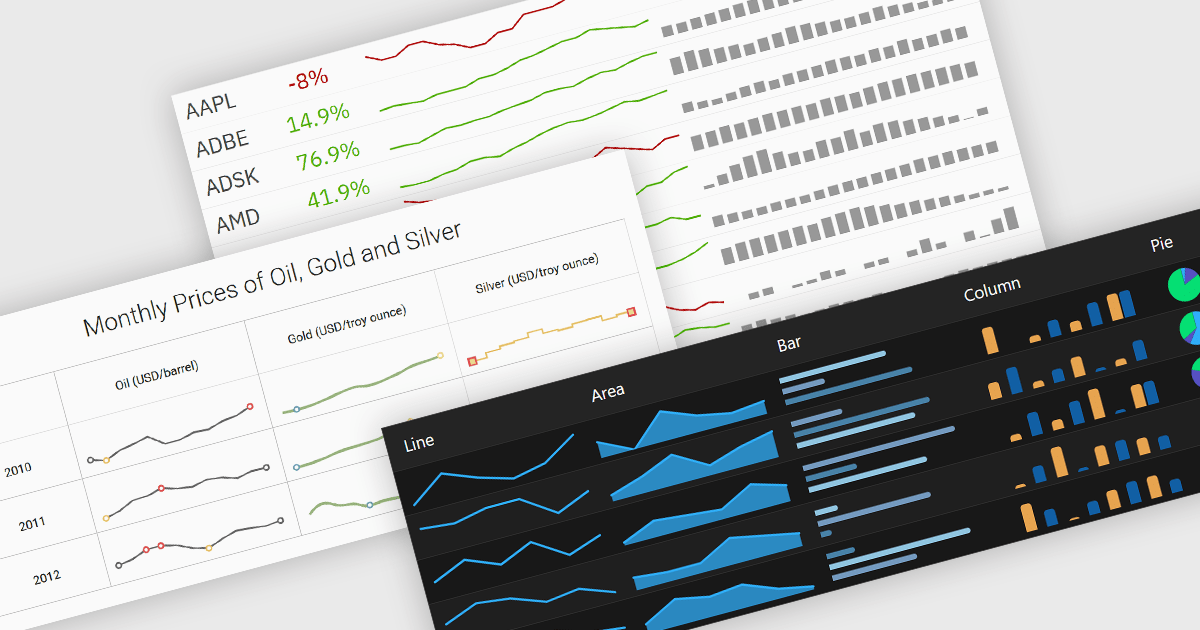
Typically embedded within text, tables/grids, or dashboards, sparklines are small-scale, data-driven graphics that present trends, patterns, or fluctuations within a dataset in a visually compact format. Unlike full-scale charts, sparklines do not include axes or labels, allowing them to present time-series or categorical data in a condensed form to deliver immediate visual cues without interrupting the flow of surrounding content. This design makes sparklines well-suited for highlighting patterns and changes over time or comparing multiple values side-by-side whilst helping users quickly identify key insights without leaving the context of the data.
Several Vue.js charting components offer sparkline functionality, including:
For an in-depth analysis of features and price, visit our comparison of Vue.js chart components.
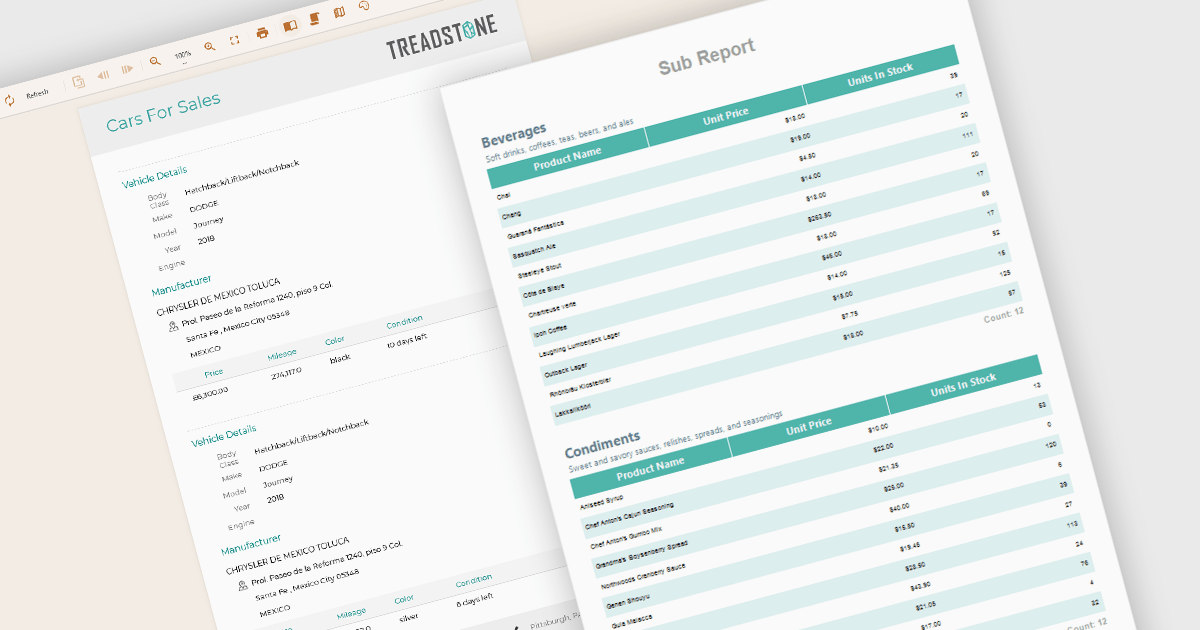
A subreport in a report component is a report embedded within another report, designed to present related or supplementary data that may not fit naturally into the main report’s structure. It is typically used when displaying hierarchical, grouped, or master-detail relationships, such as showing order items within a customer order summary. Subreports can be independently designed and then linked to the main report using parameters or shared data sources. This modular approach improves report organization and reusability, especially when similar data blocks are needed across multiple reports or sections within a complex reporting solution.
Several Angular Reporting controls offer support for subreports including:
For an in-depth analysis of features and price, visit our Angular Reporting controls comparison.
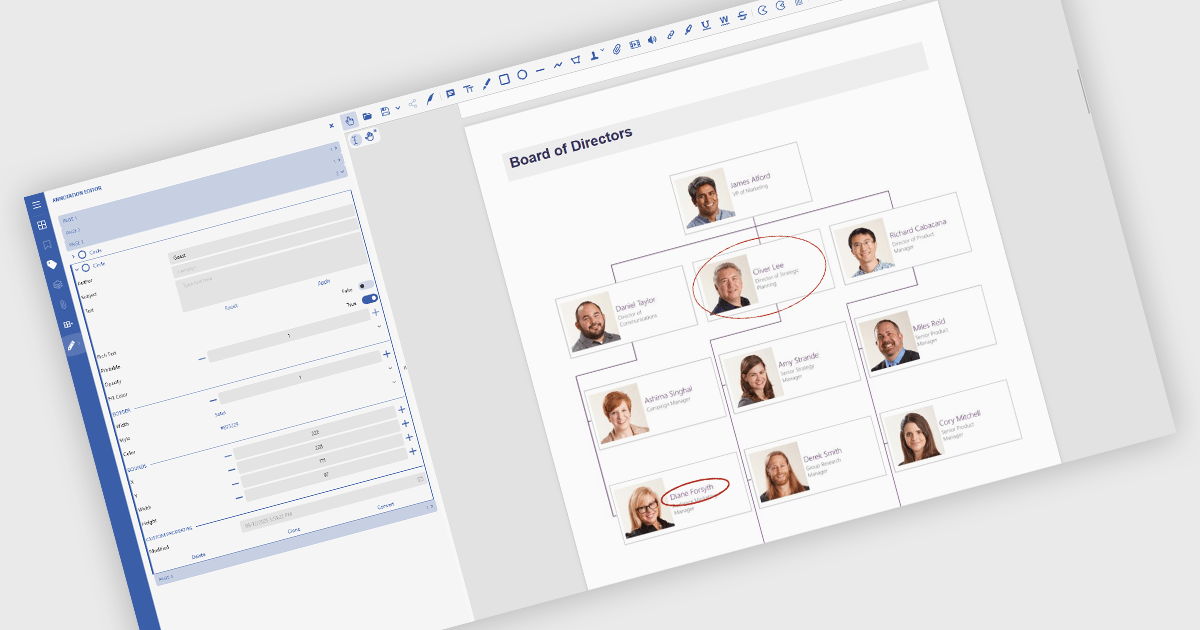
Ellipse annotations in PDF viewer components are shape‑based markups that allow users to draw oval or circular outlines (or filled ellipses) on PDF pages. Such annotations are valuable in highlighting regions, drawing attention to content, or visually marking up documents for review without altering the underlying text. They generally include settings for border color, line width, fill color or transparency, and may offer popup notes, captions, or comments associated with the ellipse shape. The feature supports both interactive use and programmatic control in many viewers.
Several React PDF viewer controls offer support for ellipse annotations including:
For an in-depth analysis of features and price, visit our React PDF viewer controls comparison.
聯繫電話: (888) 850 9911
傳真: +1 770 250 6199


