


官方供應商
我們作為官方授權經銷商,直接提供超過200家開發廠家所發行超過1000個的產品授權給您。
請參閱我們所有的品牌。
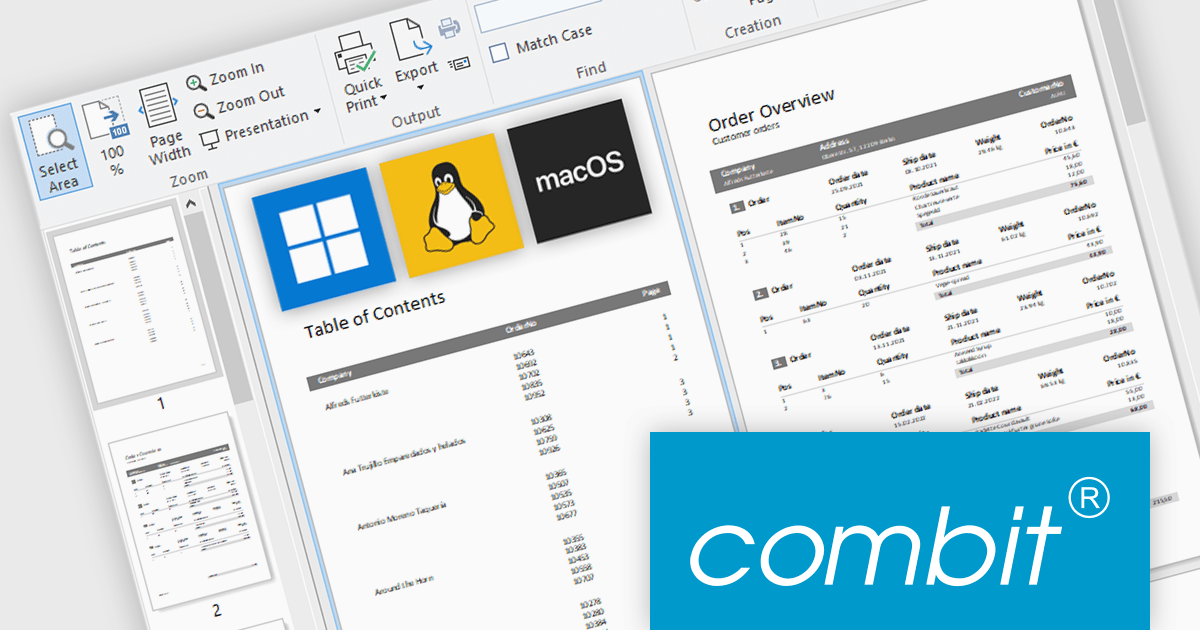
combit have announced an exciting new development for their popular report generator with the introduction of List & Label Cross Platform (LLCP), due for release in October.
This is a significant milestone for combit, as they will now offer a cross-platform reporting solution for Windows, Linux, and macOS. The new powerful print engine is entirely based on the most recent version of .NET, with no native dependencies. For reporting that runs anywhere your app runs.
Features will include:
This cross-platform functionality will only be included as part of the List & Label Enterprise Edition. To help customers benefit from this major advancement, special offers are available until October 9th 2025.
* Subscription terms for free upgrades will not be extended. Special discounted renewal options will be available until October 2026, please contact us for details.
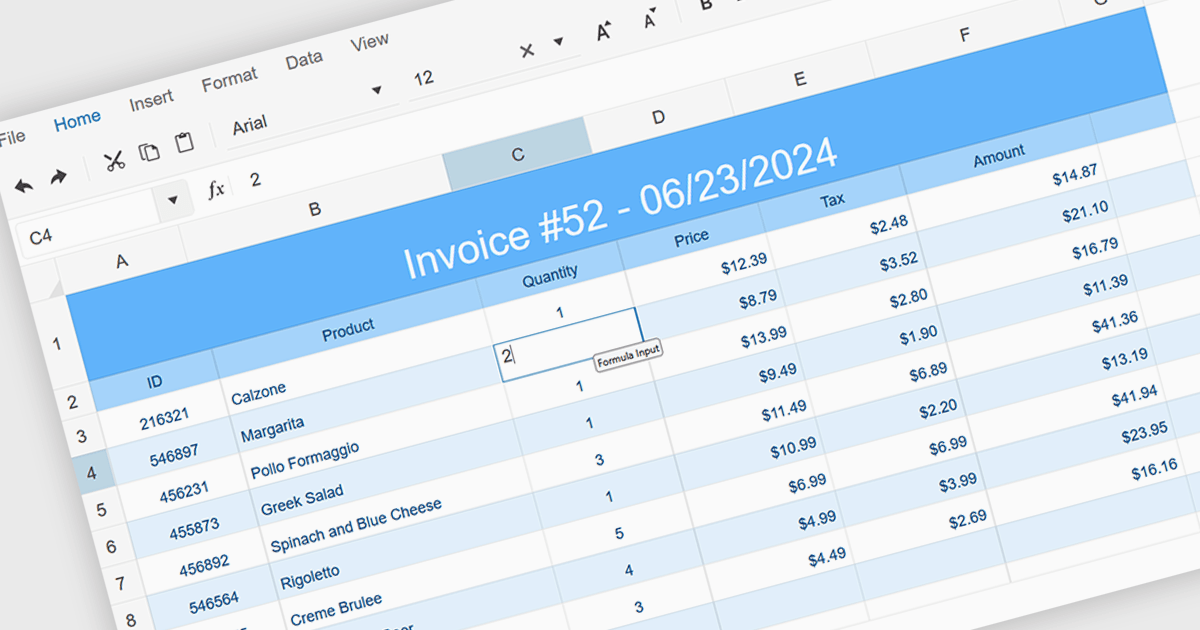
In-cell data editing allows information to be modified directly within a spreadsheet cell rather than through separate forms or dialog boxes. This approach speeds up data entry, provides immediate visual feedback, and makes it easier to spot and correct mistakes in context. It enhances efficiency by reducing interruptions, lowering cognitive effort, and offering a familiar Excel-style experience. Common use cases include updating financial figures, adjusting inventory records, or revising project timelines where quick, accurate edits are essential.
Several JavaScript spreadsheet controls support in-cell data editing including:
For an in-depth analysis of features and price, visit our comparison of JavaScript Spreadsheet Controls.
SpreadJS is a complete enterprise JavaScript spreadsheet solution used to create financial reports and dashboards, budgeting and forecasting models, scientific, engineering, healthcare, education, science lab notebooks, and other similar JavaScript business applications. Leverage the high-speed calculation engine with over 500 Excel built-in functions in 19 languages, to deliver true Excel-like spreadsheet experiences with zero dependencies on Excel.
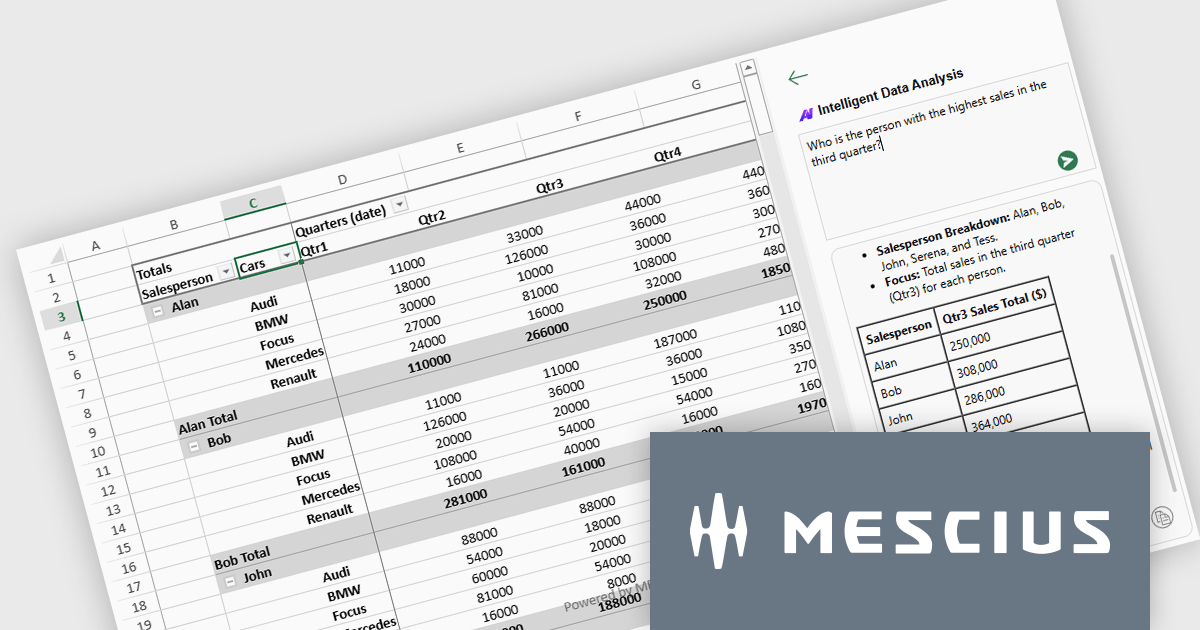
On August 21st, MESCIUS hosted a CodeClinic for the Developer Preview of the SpreadJS AI Add-on. Product Manager Chris Bannon demonstrated how to enhance your JavaScript spreadsheet applications with natural language formula generation, intelligent PivotTable creation, and AI-powered worksheet functions - all integrated directly into the spreadsheet UI.
The webinar includes the following key takeaways:
Watch the Webinar On-Demand and get ready to bring the power of AI to your JavaScript Spreadsheets.
SpreadJS is licensed per developer and includes 1 Year Maintenance (major and minor version releases and unlimited support phone calls). SpreadJS requires an Annual or Perpetual Deployment License. The optional Add-ons are available at an additional cost, and require a SpreadJS license. See our SpreadJS licensing page for full details.
For more information, visit our SpreadJS product page.
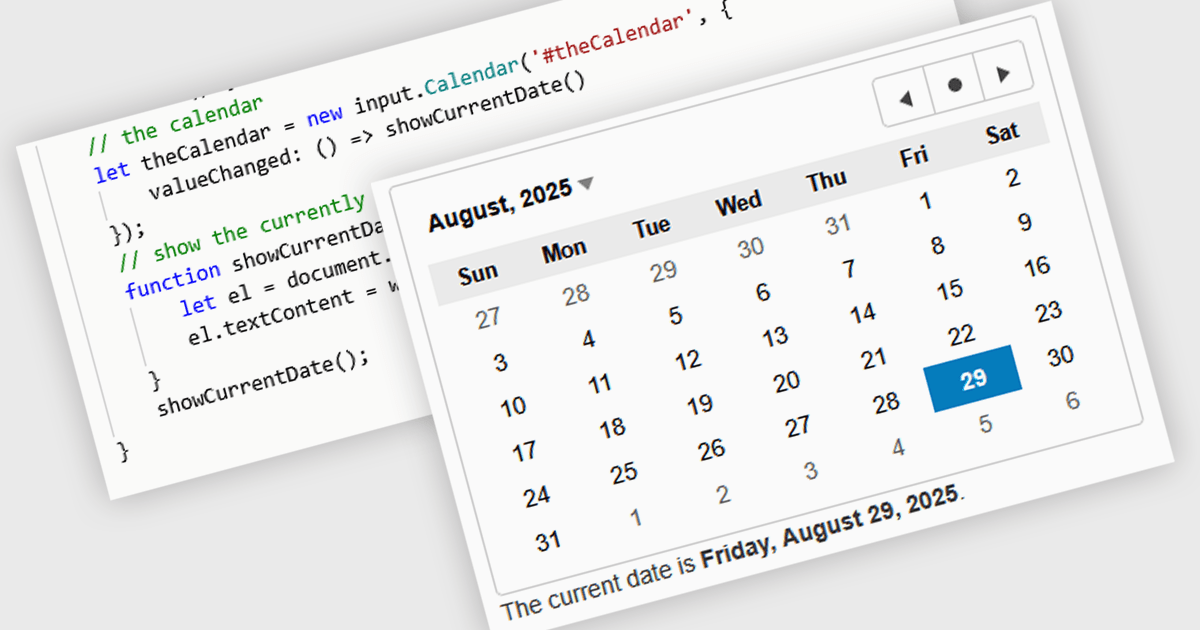
JavaScript calendar controls are user interface components that allow users to select and edit date values directly within data editing environments, such as forms or grids. These controls typically integrate a visual calendar picker, enabling consistent and accurate date input while reducing manual entry errors. For developers, they simplify validation, support localization, and integrate with various data sources, helping ensure a more efficient and user-friendly experience in web applications that require date-related input or filtering.
Several JavaScript data editor collections offer calendar controls including:
For an in-depth analysis of features and price, visit our comparison of JavaScript Data Editors.
DevCraft by Telerik is a comprehensive suite of more than 1,250 UI components and development tools designed for building modern web, desktop, and mobile applications using .NET and JavaScript frameworks. It includes reporting and report management solutions, automated testing and mocking tools, and document processing libraries, as well as a wide range of professionally designed user interface controls from the Telerik and Kendo UI suites. DevCraft enables developers to create feature-rich, high-performance applications with consistent design and user experience, delivering enterprise-level, scalable, and maintainable software solutions.
The Telerik DevCraft 2025 Q3 update extends the availability of the AI coding assistants to all of the major UI libraries. Along side Blazor and React, the AI Coding Assistant is now trained on and available for Kendo UI for Angular, Telerik UI for ASP.NET Core, UI for WPF, UI for WinForms and UI for .NET MAUI, as well as for Telerik Reporting and the Document Processing Libraries. These assistants are GitHub Copilot add-ins and MCP servers that provide context-aware and specialized AI-generated code directly in your IDE using natural language prompts, allowing developers to deliver high quality user interfaces and reporting functionality in web and desktop applications in much less time.
To see a full list of what's new in version 2025 Q3, see our release notes.
Telerik DevCraft is licensed per developer and has two licensing models: an annual Subscription License and a Perpetual License. The Subscription license provides access to the latest product updates, technical support, and exclusive benefits for a flat annual fee, and must be renewed to continue using the software. The Perpetual license is a one-time purchase granting access to the current released version and includes a one-year subscription for product updates and technical support. After this initial period, users can choose to renew the subscription element to continue receiving updates and support; otherwise, they may continue using the installed version available during their active subscription term but will forgo future updates and support. See our Telerik DevCraft Ultimate licensing page for full details.
Telerik DevCraft is available in the following editions:
聯繫電話: (888) 850 9911
傳真: +1 770 250 6199


