


官方供應商
我們作為官方授權經銷商,直接提供超過200家開發廠家所發行超過1000個的產品授權給您。
請參閱我們所有的品牌。
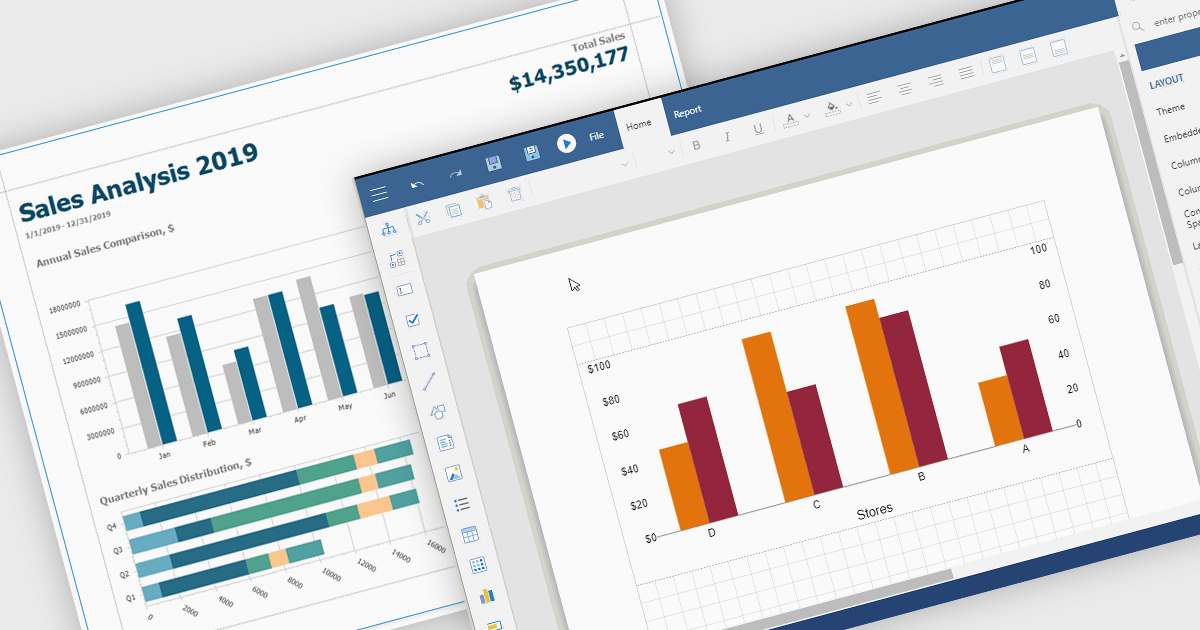
Charts in reports are graphical representations of data such as bar graphs, line charts and pie diagrams that are incorporated into business documents to illustrate key insights and trends at a glance. By converting numbers into intuitive visuals, charts improve clarity and make comparisons between categories or time periods effortless while drawing attention to critical metrics like sales growth, customer churn or budget variances. These visual tools streamline data interpretation, empower stakeholders to make faster more informed decisions, foster alignment across departments and tell a cohesive data driven story without wading through rows of figures.
Several Vue.js reporting components support charts including:
For an in-depth analysis of features and price, visit our Vue.js Reporting Components comparison.

JavaScript API as a data source in React JavaScript Charts refers to the use of custom JavaScript functions or services that fetch and supply data dynamically to chart components at runtime, rather than relying on static datasets. This approach enables charts to reflect real-time data changes, support asynchronous operations, and integrate with external APIs or internal services. It is particularly useful for applications that require up-to-date information, such as dashboards, monitoring tools, or analytics platforms. The key advantage is enhanced flexibility and responsiveness, allowing developers to handle complex data flows, perform live updates, and tailor chart behavior based on interactive or conditional logic.
Several React Chart Controls offer support for using JavaScript API as a data source including:
For an in-depth analysis of features and price, visit our comparison of React Chart Controls.
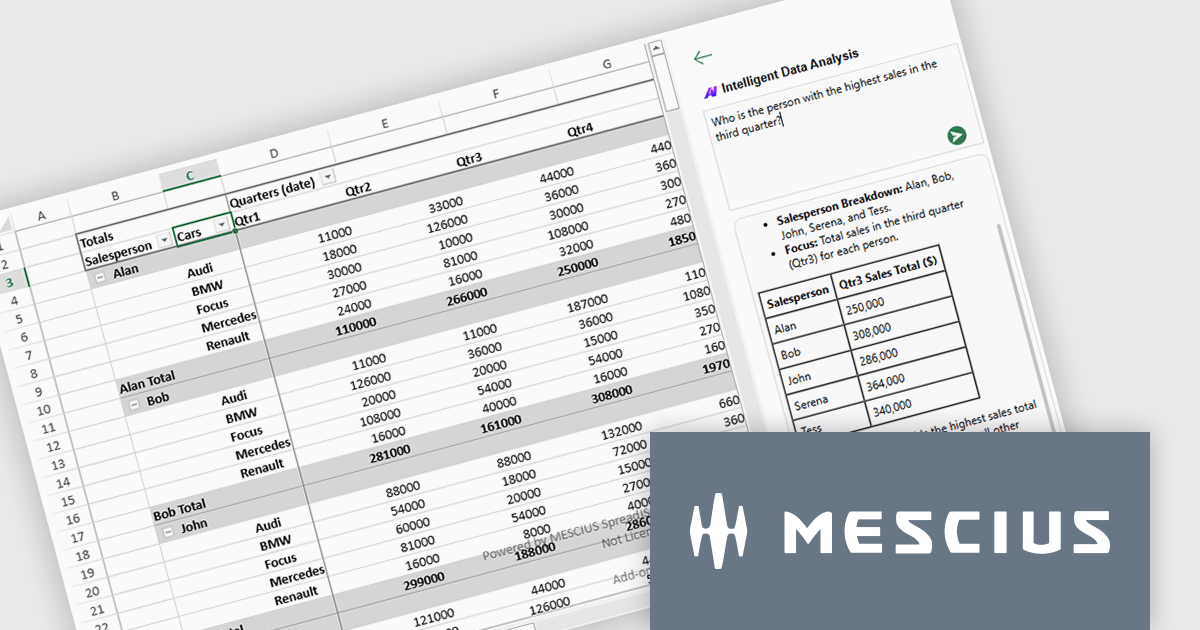
SpreadJS by MESCIUS is a high-performance JavaScript spreadsheet component designed to integrate Excel-like functionality into web applications. It allows developers to deliver robust spreadsheet experiences within their applications, complete with features like data import/export, complex formulas, conditional formatting, and extensive customization options. SpreadJS caters to a wide range of use cases, from financial modeling and data analysis to project management and interactive dashboards, ultimately allowing developers to build feature-rich and user-friendly web applications. SpreadJS 18.1 includes a Developer Preview of powerful AI-driven features designed to transform how users interact with JavaScript spreadsheets.
In this blog post, SpreadJS Product Manager Chris Bannon takes you through each of these AI features, shows you how to use them, and highlights the value they can bring to your JavaScript applications. The SpreadJS AI Add-on preview includes the following capabilities:
Read the full blog to get started exploring the benefits available in adding AI into your JavaScript spreadsheets.
SpreadJS is licensed per developer and includes 1 Year Maintenance (major and minor version releases and unlimited support phone calls). SpreadJS requires an Annual or Perpetual Deployment License. The optional Add-ons are available at an additional cost, and require a SpreadJS license. See our SpreadJS licensing page for full details.
For more information, visit our SpreadJS product page.
Infragistics Professional is a comprehensive suite of UI components designed to accelerate the development of high-performance, visually rich applications across several platforms. It provides developers with a vast collection of tools for building data-driven interfaces, including advanced grids, charts, and reporting features for web, desktop, and mobile environments.
Ignite UI for Angular (included in Infragistics Professional) includes a rich collection of high-performance components that help developers to build modern, data-rich web applications with speed and precision. With features like an advanced data grid, sophisticated charting capabilities, and full accessibility support, Ignite UI for Angular helps developers create responsive interfaces more easily and simplifies common tasks involved in building Angular applications.
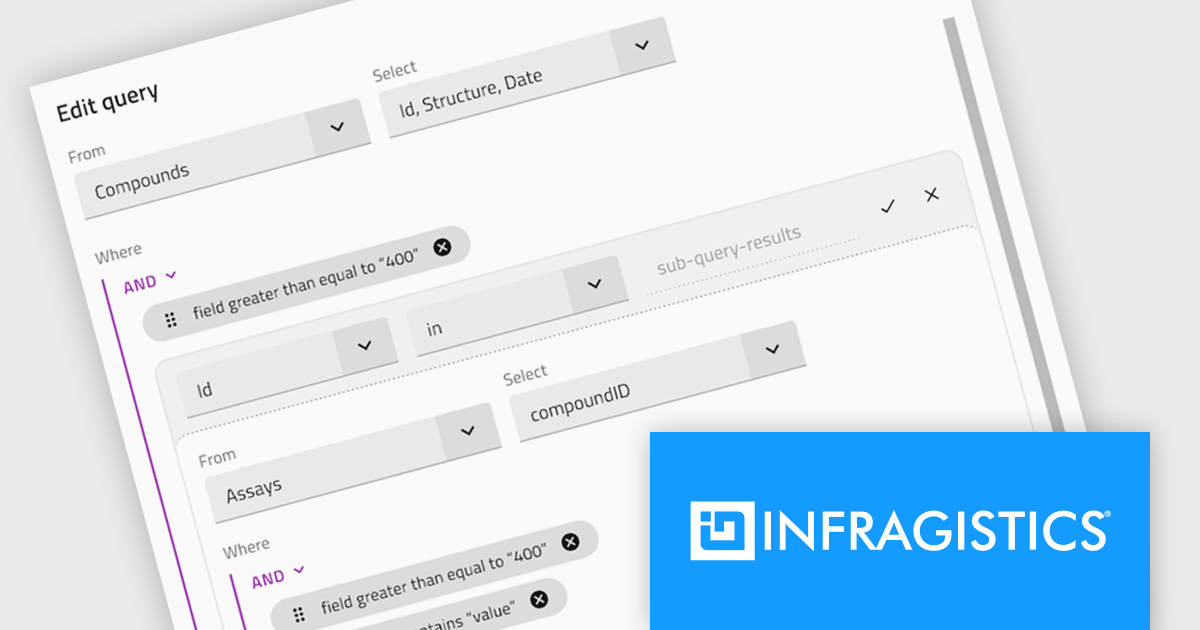
The Infragistics Professional 25.1 release introduces a powerful enhancement to its Angular Query Builder component - support for nested SQL queries using IN and NOT IN operators. This addition allows users to design subqueries visually within the Query Builder interface, effectively embedding one query inside another without writing manual SQL. The update brings the expressive power of SQL subqueries into the hands of users through a clean, intuitive UI, making it significantly easier to handle complex data filtering logic in Angular applications.
To see a full list of what's new in version 25.1, see our release notes.
Infragistics Professional is licensed per developer and is available as a Perpetual License with a 1, 2 or 3 year support and maintenance subscription. See our Infragistics Professional licensing page for full details.
For more information, visit our Infragistics Professional product page.

ComponentSource has played a central role in broadening access to Sencha’s suite of development tools by making them more readily available to a global developer audience. Its distribution infrastructure has helped ensure that organizations - including many in the Fortune 100 - can obtain the tools they need to build and maintain complex, data-driven web applications across platforms.
For five years, ComponentSource has supported developers by providing a straightforward route to acquiring Sencha's products. This collaboration reflects a shared goal: to make software procurement simpler and more reliable, particularly for teams working on large-scale or multi-device applications.
Celebrating a successful 5-year journey, ComponentSource and Sencha look forward to further empowering development teams globally. This continued collaboration aims to enhance the availability and adoption of Sencha's tools, enabling even more organizations to build sophisticated web applications for diverse devices.
For more information, visit our Sencha brand page.
聯繫電話: (888) 850 9911
傳真: +1 770 250 6199


