













官方供應商
我們作為官方授權經銷商,直接提供超過200家開發廠家所發行超過1000個的產品授權給您。
請參閱我們所有的品牌。
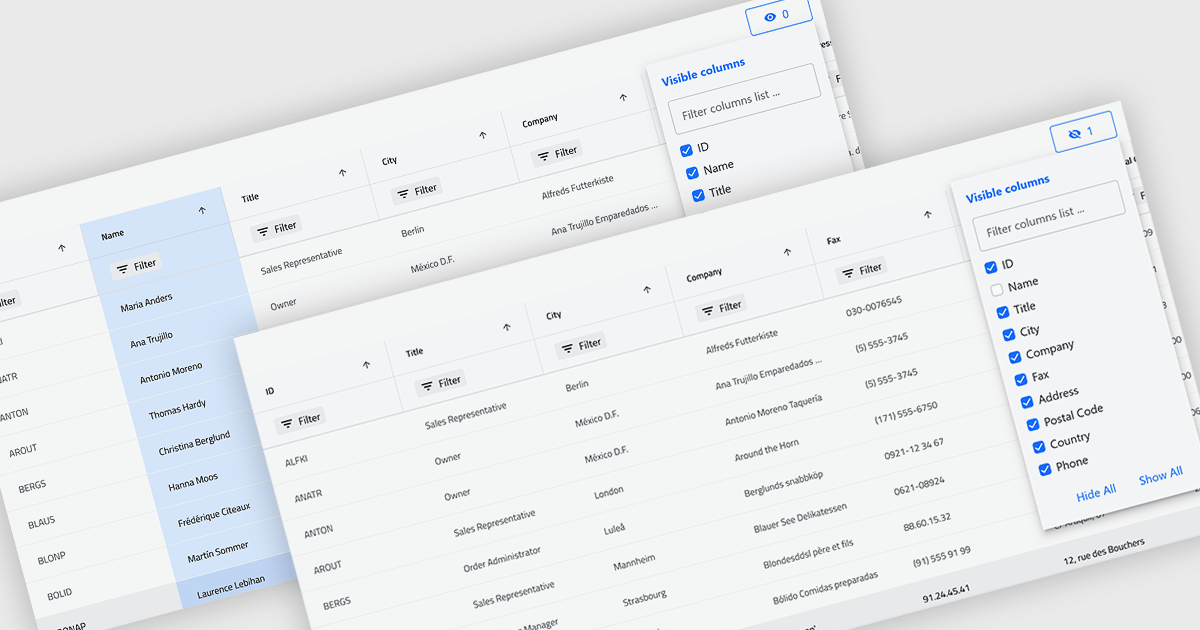
Column hiding in grids allows users to temporarily remove selected columns from view without deleting the underlying data. This provides a more focused and flexible way to work by showing only the fields relevant to a specific task or role. By reducing visual clutter and optimizing screen space, it improves readability and makes data easier to scan and analyze. For example, a financial analyst might display only revenue and profit columns for performance review, while a project manager may hide technical fields to focus on timelines and resources. Because columns can be restored at any time, the feature supports personalized, non-destructive customization.
Several .NET Blazor Grid controls offer the ability to hide columns including:
For an in-depth analysis of features and price, visit our .NET Blazor Grid controls comparison.
TeeChart for .NET is a comprehensive charting solution that enables developers to create informative, visually compelling charts for financial, scientific, statistical, and business applications. It manages complex data and delivers interactive visualizations. With optional source code and enterprise editions that include mobile and JavaScript components, TeeChart for .NET provides flexibility, customization, and consistent charting across desktop, web, and mobile platforms.
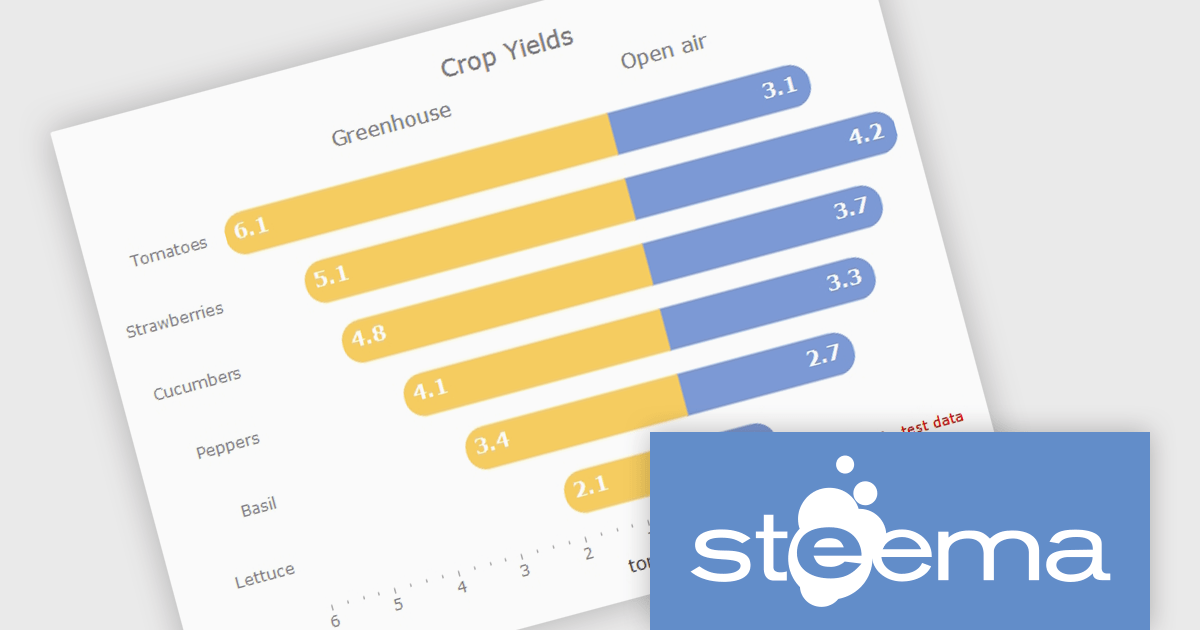
The TeeChart for .NET 2006 update introduces a Tornado Chart series type that enables developers to present structured side-by-side comparisons and perform sensitivity analysis. This chart type is particularly effective for highlighting the relative impact of multiple variables, making it well suited for financial modeling, risk assessment, and analytical dashboards. By offering built-in support within the existing TeeChart framework, it reduces the need for custom visualization logic, accelerates development time, and ensures consistent integration across reporting, analytics, and business applications.
To see a full list of what's new in version 2026, see our release notes.
TeeChart for .NET is licensed per developer and is available as a perpetual license. Each license includes one year of updates and upgrades. See our TeeChart for .NET Pro Edition licensing page for full details.
This update for TeeChart for .NET is available is available in the following products:

.netCHARTING is a comprehensive charting solution designed for C# and VB.NET developers working with ASP.NET or WinForms. It enables the rapid creation of dynamic, data-driven charts with minimal coding effort. Built entirely with managed C# code, .netCHARTING seamlessly integrates data access, aggregation, and visualization, allowing developers to generate interactive and visually compelling charts from various data sources, including SQL Server, Oracle, and MySQL. The platform supports a wide array of chart types - such as bar, line, pie, and geographic maps - and offers features like JavaScript and HTML5 charting for enhanced interactivity across devices, including mobile platforms. By automating complex tasks like date handling and data aggregation, .netCHARTING simplifies the development process, enabling professionals to deliver insightful data visualizations efficiently.
The .netCHARTING 10.8 release introduces official .NET 10 support with a dedicated NuGet package and sample bundle that run on the latest Microsoft tooling, enabling developers to build and optimize visualizations on the newest cross-platform .NET platform. This update ensures compatibility with the latest Visual Studio 2026 and Windows Server environments, letting teams leverage the performance and productivity improvements of .NET 10 in their charting solutions while continuing to benefit from a mature, feature-rich chart control.
.netCHARTING is licensed per site (1 web site on 1 server), per server (unlimited web sites on 1 server) or per developer (single application) and is available as a perpetual license with a 12 month subscription which includes major and minor upgrades and priority email support. See our .netCHARTING licensing page for full details.
For more information, visit our .netCHARTING product page.

Right to left (RTL) support in reporting components enables reports to correctly display languages such as Arabic and Hebrew, where text flow, alignment, and layout follow a right-to-left reading order. This capability typically affects text rendering, page layout, table alignment, and user interface elements, helping reports remain readable and culturally appropriate without requiring separate report designs.
Several Blazor reporting controls offer right-to-left (RTL) support including:
For an in-depth analysis of features and price, visit our Blazor reporting controls comparison.

Trend lines in charts are analytical tools that represent the general direction or tendency of data over time, helping users interpret patterns that may not be immediately visible in raw data. By smoothing out short-term fluctuations, trend lines clarify long-term behavior, highlight growth or decline, and support more informed decision-making. They are commonly used in business dashboards to track performance metrics, in financial analysis to assess market trends, and in operational reporting to identify recurring patterns, forecast outcomes, and compare multiple data series with greater clarity.
Several Blazor chart components provide trend line support including:
For an in-depth analysis of features and price, visit our Blazor Chart Component comparison.
聯繫電話: (888) 850 9911
傳真: +1 770 250 6199


