


官方供應商
我們作為官方授權經銷商,直接提供超過200家開發廠家所發行超過1000個的產品授權給您。
請參閱我們所有的品牌。
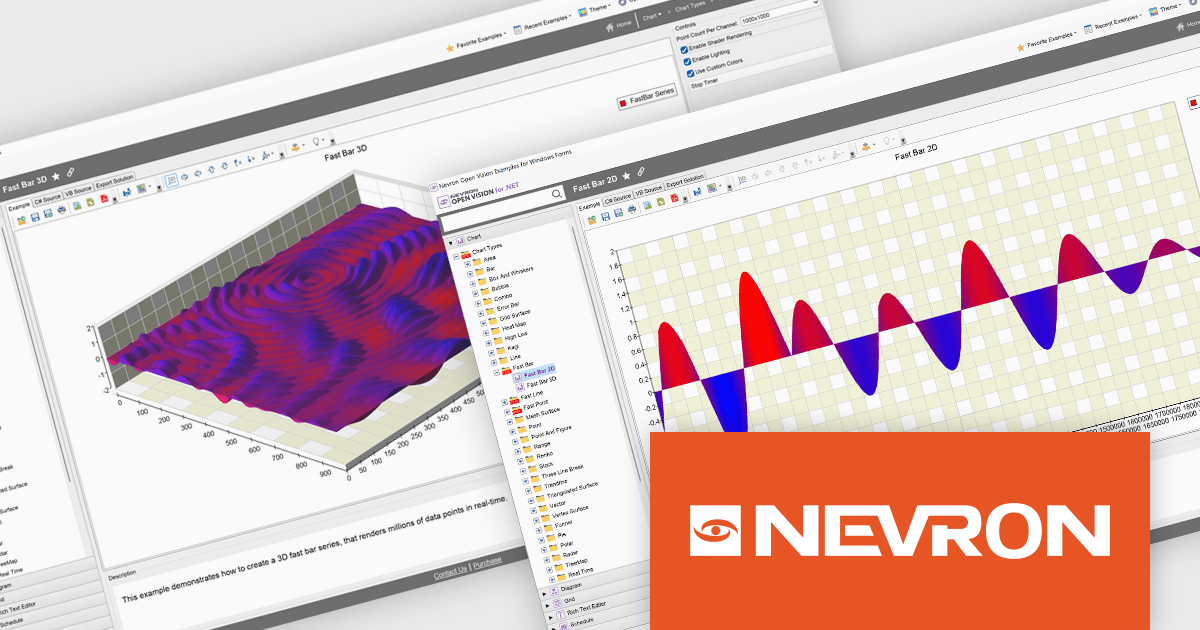
NOV Chart for .NET by Nevron is a comprehensive .NET charting component suite designed for cross-platform application development. It offers an array of 2D and 3D chart types, along with smart data labeling, an advanced chart axes model, numerous interactivity features and GPU-accelerated real-time rendering based on OpenGL. This library allows developers to seamlessly integrate rich, dynamic and interactive business, scientific, financial and presentation data visualizations into their .NET applications for more effective communication.
The NOV Chart for .NET 2025.1 update introduces Fast Bar, Fast Line, and Fast Point series that leverage GPU acceleration to deliver real-time visualization of extremely large datasets, enabling developers to render millions of data points with minimal latency in both 2D and 3D contexts and apply per-point color information for detailed analysis. By offloading heavy rendering tasks to the GPU, these new series reduce CPU overhead and free resources for other application logic, making them particularly valuable in scientific, engineering, and medical scenarios where high-throughput data streams must be displayed without delay.
To see a full list of what's new in 2025.1, see our release notes.
NOV Chart for .NET is licensed per developer and is available as a perpetual license with 1 year support and maintenance. See our NOV Chart for .NET licensing page for full details.
NOV Chart for .NET is available in the following products:

Since 2022, ComponentSource has expanded global access to Blazorise’s high performance UI component library by offering it through their comprehensive catalog of developer tools. Blazorise’s modular architecture and seamless integration with Bootstrap, Bulma, AntDesign and Material perfectly complement ComponentSource’s mission to provide versatile, high-quality components for any project.
Over the past three years, this partnership has demonstrated a shared commitment to delivering feature rich Blazor UI solutions including theming, form validation, localization, data grids and charting that integrate seamlessly into modern web applications.
As they mark three years of working together, ComponentSource and Blazorise continue to support developers with a growing ecosystem of modern UI components, proactive feature enhancements, comprehensive documentation, and expert support that accelerate Blazor application development.
Blazorise is licensed per developer and is runtime royalty free. Licenses include a 1 year subscription for updates and premium support. Professional, Enterprise, and Enterprise Plus editions are available, each offering tailored levels of support and service to meet varying business needs. See our Blazorise licensing page for full details.
For more information, visit our Blazorise brand page.
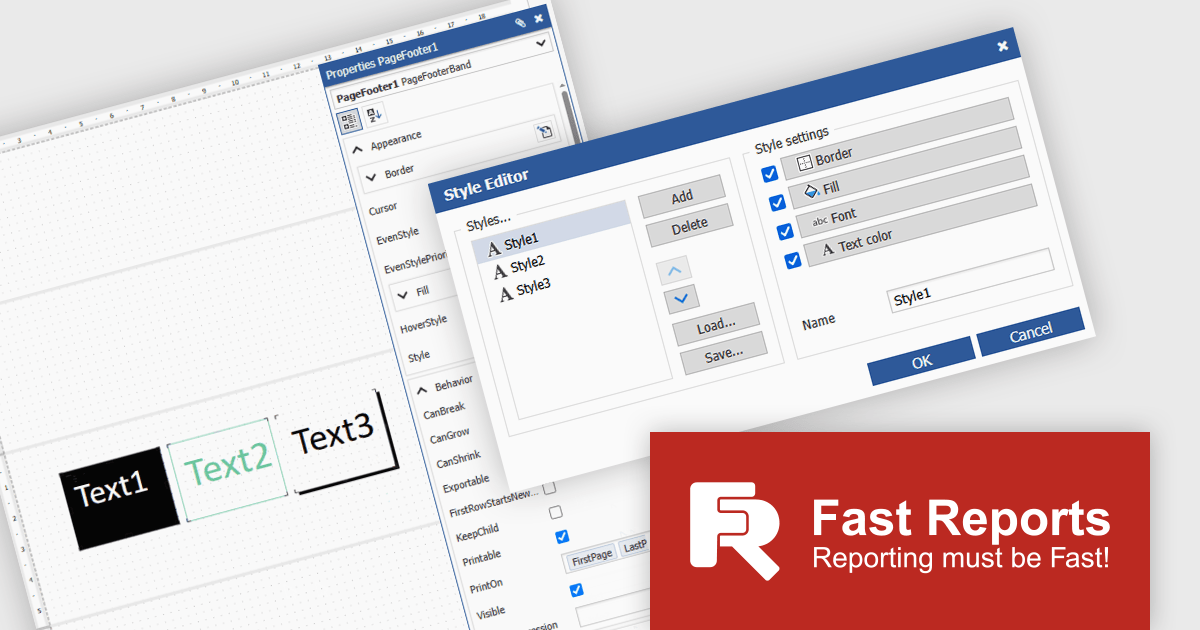
FastReport Online Designer is a cross platform visual report designer for FastReport .NET that enables users to create, edit and view reports on any device running Android, iOS or Windows through a modern web browser on computers, tablets, smartphones, game consoles or TV sets. Common use cases include remote collaboration on operational dashboards, embedding interactive reporting in web applications and empowering business users to customize and share up to date analyses without installing additional software.
FastReport Online Designer 2025.2 introduces a new style editor that enables users to define and manage report styles in one place. By allowing customization of fill colors, fonts, borders, and more, the feature removes the need for repetitive manual formatting. Users can now create a single style and apply it across multiple components, ensuring visual consistency and reducing formatting time.
To see a full list of what's new in v2025.2, see our release notes.
FastReport Online Designer is available as a license option in the FastReport .NET Components Packages. It is included in FastReport Ultimate .NET and FastReport Web .NET. See our FastReport Online Designer licensing page for full details.
For more information, see our FastReport Online Designer product page.
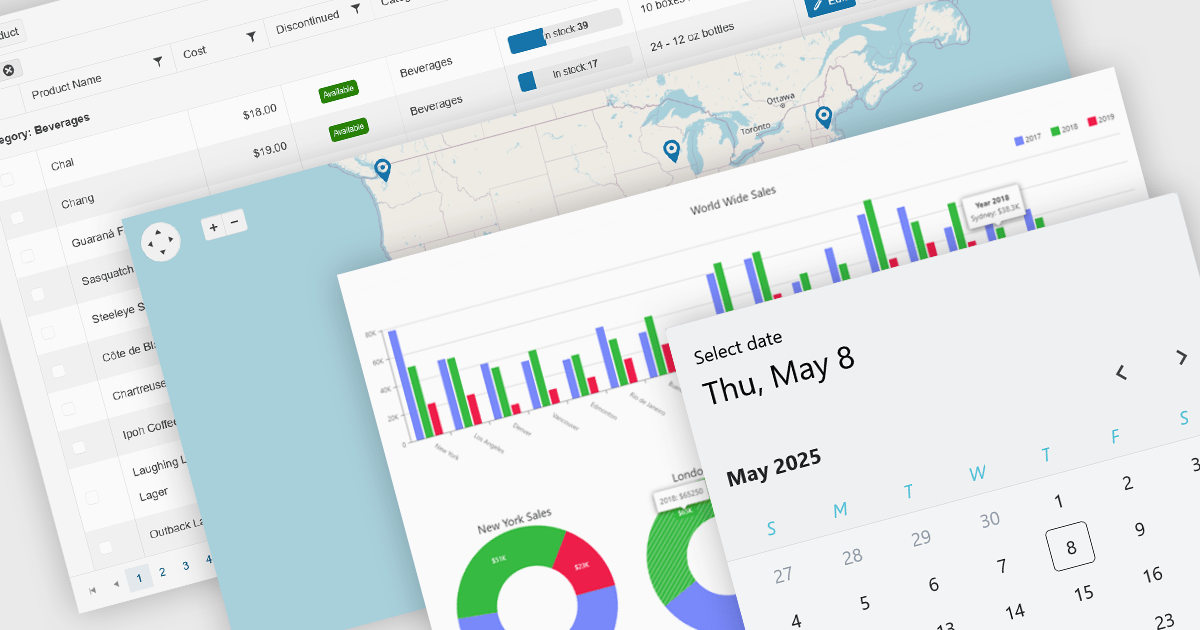
UI controls designed for use with Microsoft's Blazor framework, support full-stack development in C# and .NET, simplifying the creation of modern web applications. These controls are typically bundled into UI suites, providing developers with pre-built, customizable elements that improve the creation of rich, interactive web interfaces without needing JavaScript. By leveraging WebAssembly or server-side rendering, Blazor UI suites allow for an easy developer experience, consistent performance, and strong integration with existing .NET libraries and tooling.
Common controls include:
For an in-depth analysis of features and price, visit our Blazor UI suites comparison.
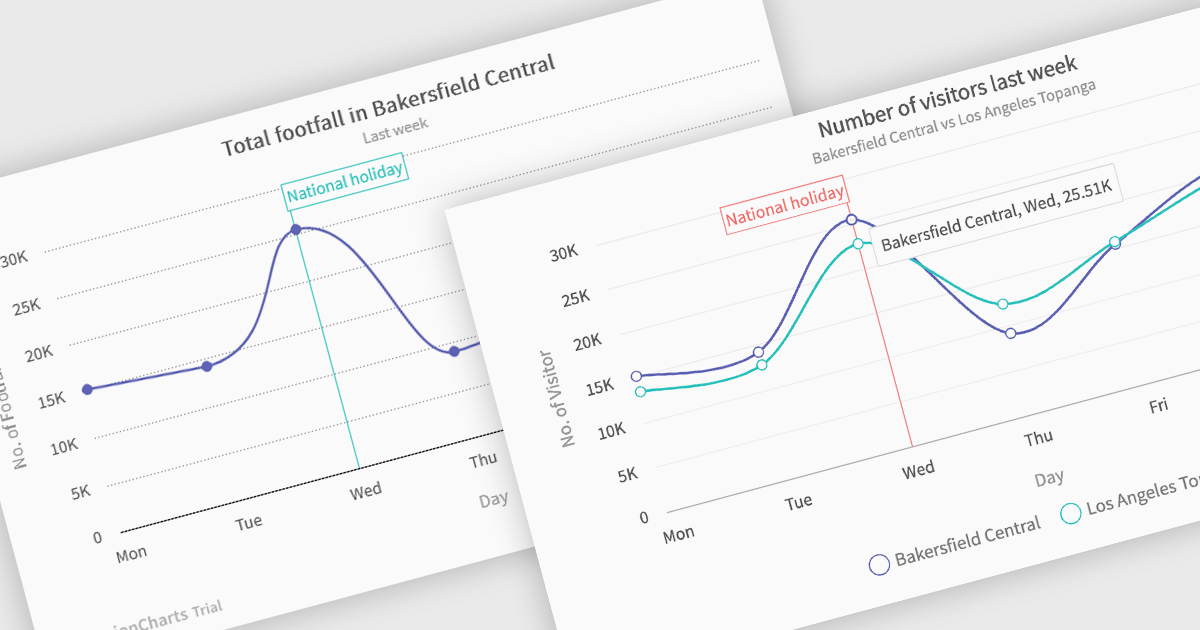
Spline charts are a type of line graph that displays continuous data points connected by smooth, curved lines, offering a visually fluid representation of trends and changes over time. This smoothing effect helps to highlight the overall trajectory of the data and can provide estimations of values between plotted points. Multi-Series Spline Charts extend this functionality by plotting multiple related datasets on the same graph, enabling direct visual comparison of their trends and the identification of correlations or divergences.
Several .NET Blazor chart controls offer spline charts including:
For an in-depth analysis of features and price, visit our .NET Blazor chart controls comparison.
聯繫電話: (888) 850 9911
傳真: +1 770 250 6199


