


官方供應商
我們作為官方授權經銷商,直接提供超過200家開發廠家所發行超過1000個的產品授權給您。
請參閱我們所有的品牌。
ActiveReports.NET from MESCIUS, is a comprehensive reporting solution for developers building applications in .NET. It empowers you to design and deliver visually appealing reports through user-friendly designers and a wide range of controls. ActiveReports simplifies report creation and distribution with a versatile API, rich data source connectivity, and support for multiple export formats. This translates to increased developer productivity and improved end-user experience with powerful reporting functionalities within your .NET applications.
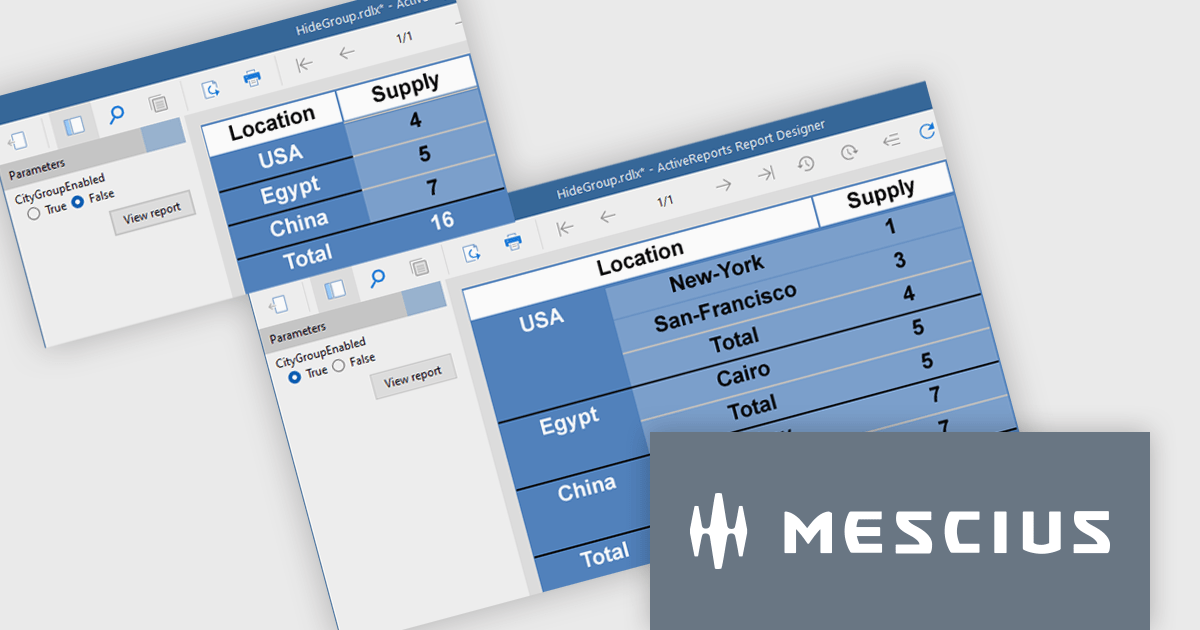
The ActiveReports v19.1 update introduces enhanced grouping control that allows developers to enable or hide groups in Tables, BandedLists, and Tablix controls based on expressions or parameters. This capability makes it easier to design reports that adapt at runtime to different data scenarios or user inputs, without requiring code changes. By configuring the new "Enabled" and "Hidden" properties directly within the report definition, developers can deliver more flexible and maintainable reporting solutions that respond dynamically to business logic.
To see a full list of what's new in v19.1, see our release notes.
ActiveReports.NET is licensed per developer and is available with or without a 12 month support and maintenance subscription. See our ActiveReports.NET licensing page for full details.
Learn more on our ActiveReports.NET product page.
In a UI suite, layout refers to the arrangement and alignment of interface elements, such as widgets, charts, controls, and navigation bars, into a coherent structure that prioritizes usability and visual hierarchy. Effective layouts ensure that users can intuitively find and interact with content, while developers benefit from built-in support for responsive grids, flexible spacing, and adaptive positioning that simplifies the creation of consistent interfaces across devices.
Several .NET Blazor UI suites offer layout components including:
For an in-depth analysis of features and price, visit our .NET Blazor UI suites comparison.
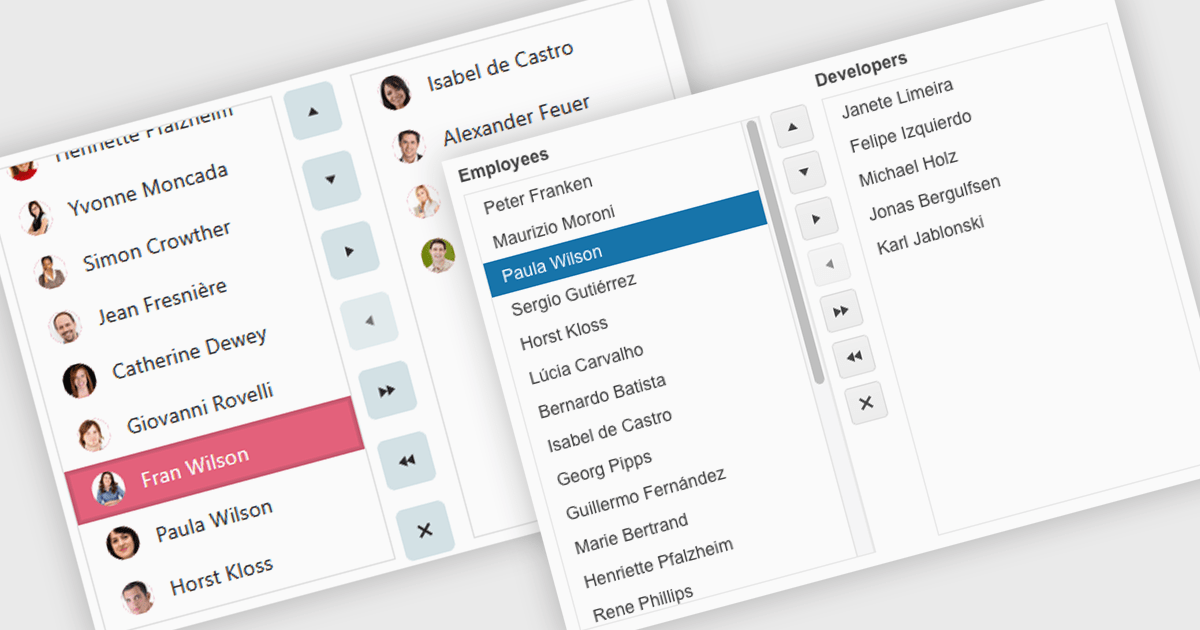
Listboxes are interactive controls that present users with a scrollable list of predefined options, allowing single or multiple selections without manual entry. By constraining inputs to valid choices and offering keyboard navigation, real-time filtering, and drag-and-drop reordering, they reduce errors and help maintain data integrity. Additionally, customizable templates let developers incorporate icons, colors, or detailed item descriptions, making complex data sets easier to scan. Overall, listboxes offer a compact, intuitive interface that balances flexibility with consistency, boosting productivity wherever structured data selection is needed.
Several .NET Blazor data editor collections can provide you with a listbox including:
For an in-depth analysis of features and price, visit our .NET Blazor data editors comparison.
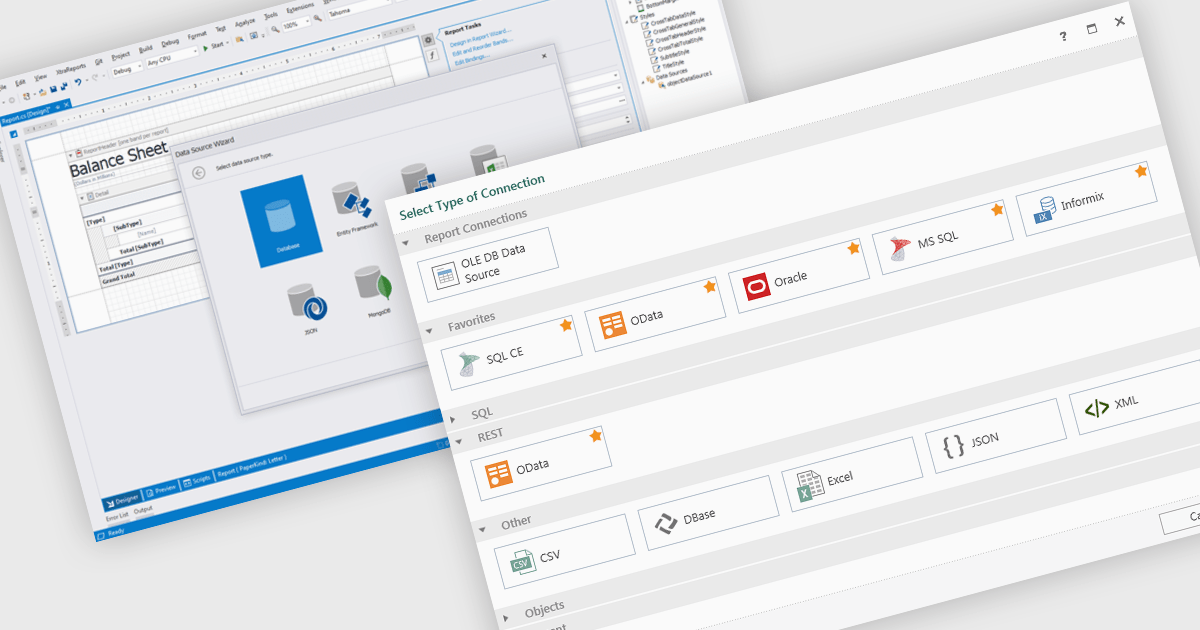
Data connectivity is a foundational aspect of modern reporting components, enabling applications to retrieve and present data from a wide variety of sources. Whether integrating with relational databases, cloud services, or flat files, effective data connectivity ensures that reports reflect current, accurate information. Reporting components are designed to abstract the complexity of accessing these data sources, providing developers with flexible APIs and tools to bind data into visualizations and formatted reports.
Common features include:
For an in-depth analysis of features and price, visit our Blazor reporting components comparison.
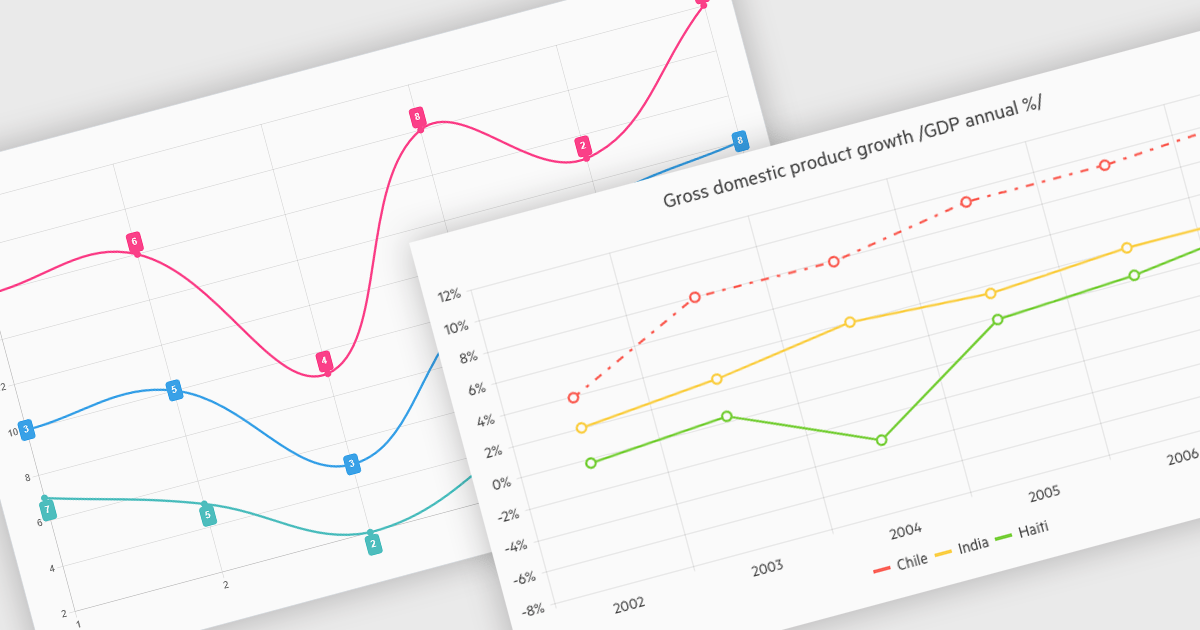
Line charts connect data points with lines to show how values change over a continuous scale, usually time. They make it easy to reveal long-term trends, seasonal patterns and sudden shifts while comparing multiple series on the same axes. Common applications include tracking stock prices, monitoring website traffic, analyzing climate data and comparing regional sales to guide business strategy. By highlighting progression and anomalies without clutter, line charts help turn raw numbers into clear, actionable insights.
Several .NET Blazor Chart Controls offer support for line charts including:
For an in-depth analysis of features and price, visit our comparison of .NET Blazor Chart Controls.
聯繫電話: (888) 850 9911
傳真: +1 770 250 6199


