


官方供應商
我們作為官方授權經銷商,直接提供超過200家開發廠家所發行超過1000個的產品授權給您。
請參閱我們所有的品牌。
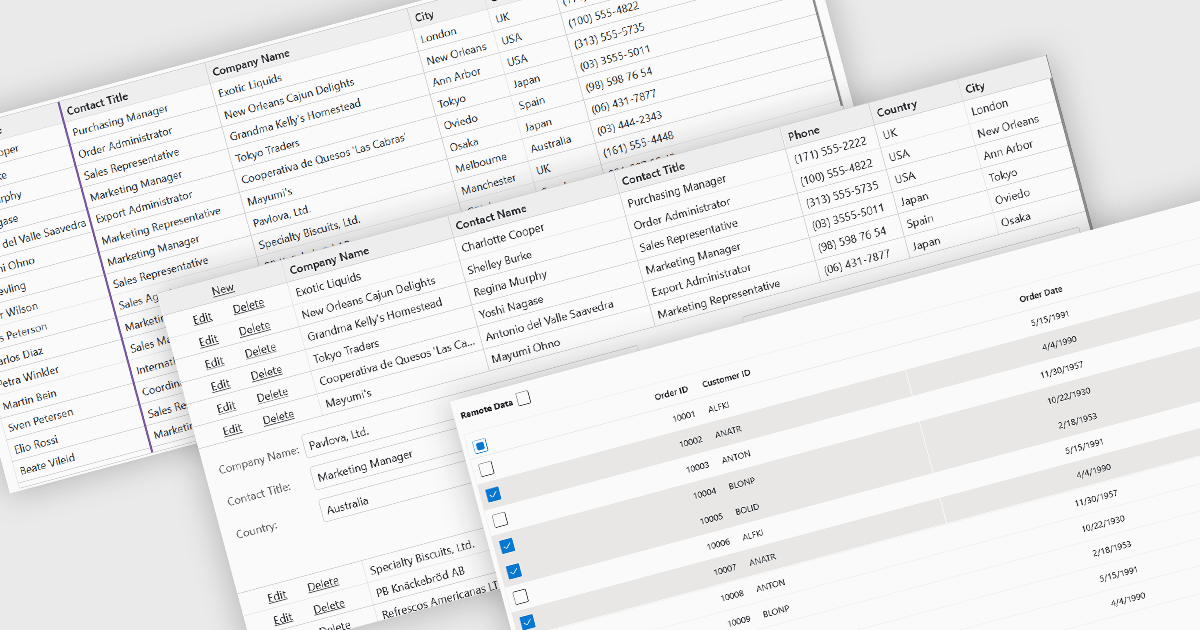
Row and column features form the core of modern grid components, enabling users to view, navigate, and manipulate tabular data efficiently. These capabilities improve usability and help developers present information in a structured, interactive format suited to many types of applications. By offering clear ways to organise, edit, and inspect information, row and column features allow users to work more effectively while maintaining control over how content is displayed.
Common features include:
For an in-depth analysis of features and price, visit our Blazor grid components comparison.
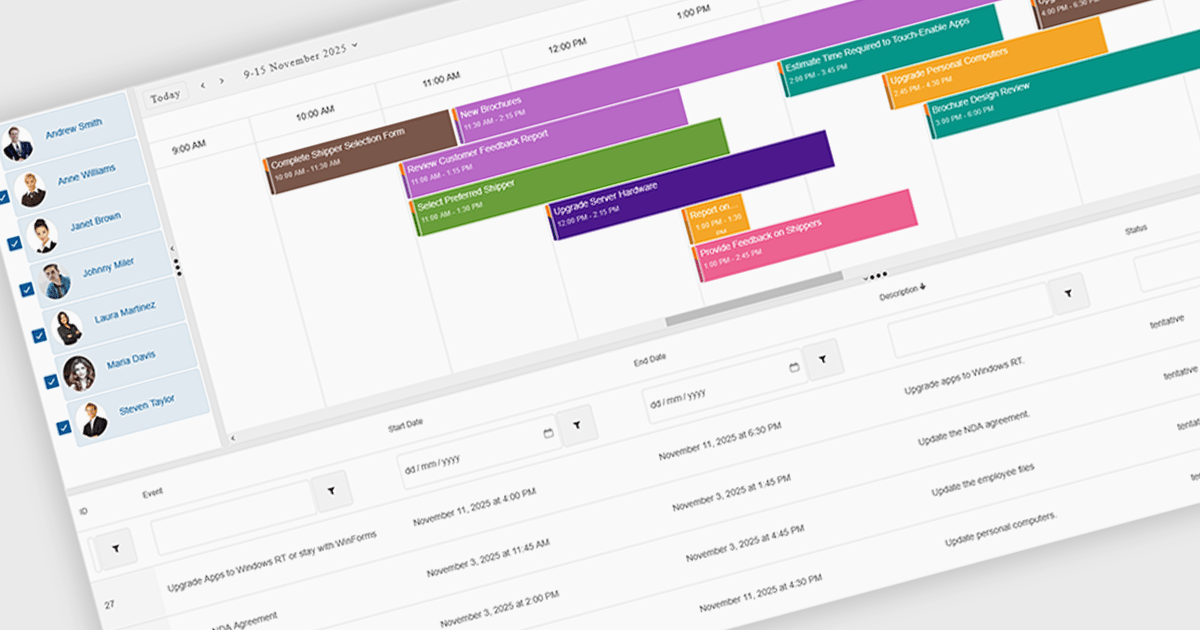
Scheduling components in UI suites provide a visual, interactive way to manage time-based data, with features such as multi-view calendars, drag-and-drop editing, recurrence rules, and group scheduling to simplify planning. They let organizations display daily, weekly, monthly, or timeline views, compare team availability, and tailor the interface to match branding or workflows. Integrated with backend data sources, scheduling components improve clarity, reduce conflicts, and save time across use cases like meeting booking, project management, staff coordination, and customer appointments.
Several .NET Blazor User Interface suites offer scheduling controls including:
For an in-depth analysis of features and price, visit our .NET Blazor UI suites comparison.
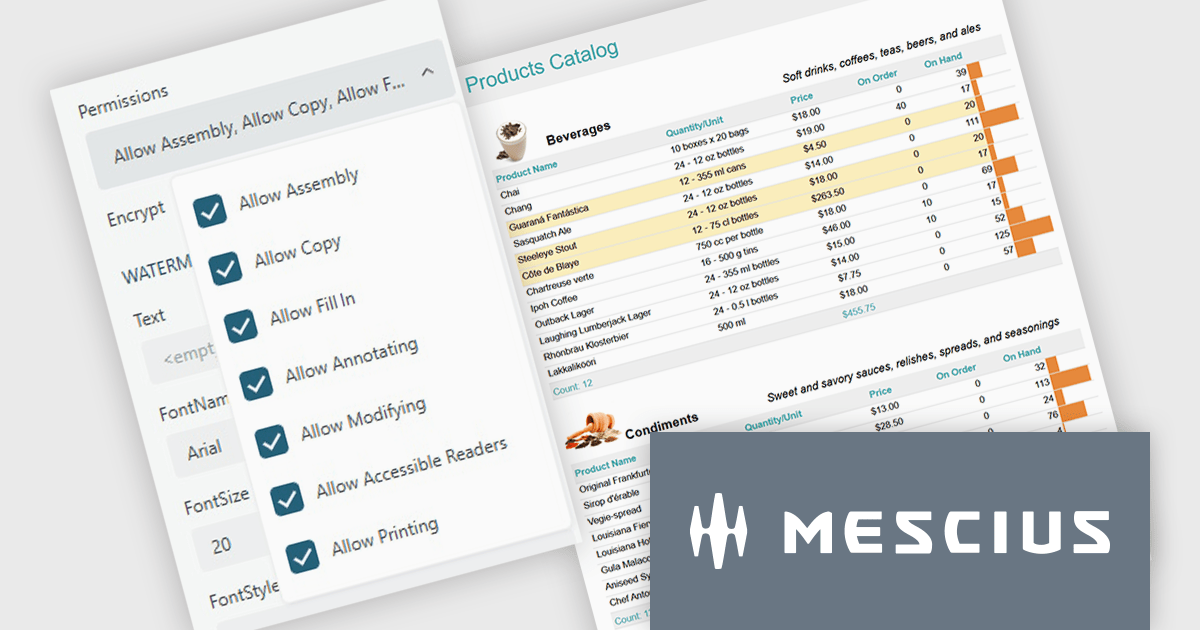
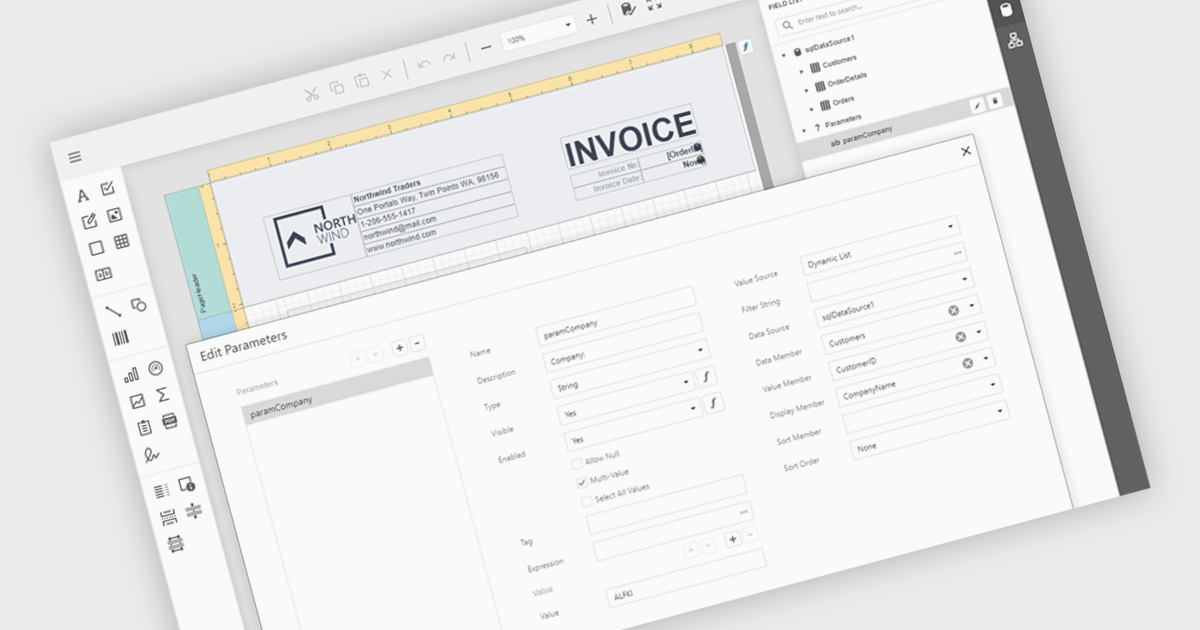
ActiveReports.NET from MESCIUS, is a comprehensive reporting solution for developers building applications in .NET. It helps you to design and deliver visually appealing reports through user-friendly designers and a wide range of controls. ActiveReports simplifies report creation and distribution with a versatile API, rich data source connectivity, and support for multiple export formats. This translates to increased developer productivity and improved end-user experience with powerful reporting functionalities within your .NET applications.
The ActiveReports.NET v19.2 update introduces configurable permissions for PDFs exported from Web Viewers, allowing developers to apply precise controls over how end users interact with generated documents. By enabling encryption and selecting permissions such as copying, printing, annotating, modifying, filling forms, and accessing content through assistive readers, developers can enforce security, compliance, and workflow requirements directly within the export process. This update optimizes permission management across the JS Viewer, Blazor Viewer, and ASP.NET WebViewer, providing a consistent and efficient way to govern document behavior without additional code or external tooling.
To see a full list of what's new in v19.2, see our release notes.
ActiveReports.NET is licensed per developer and is available with or without a 12 month support and maintenance subscription. See our ActiveReports.NET licensing page for full details.
Learn more on our ActiveReports.NET product page.
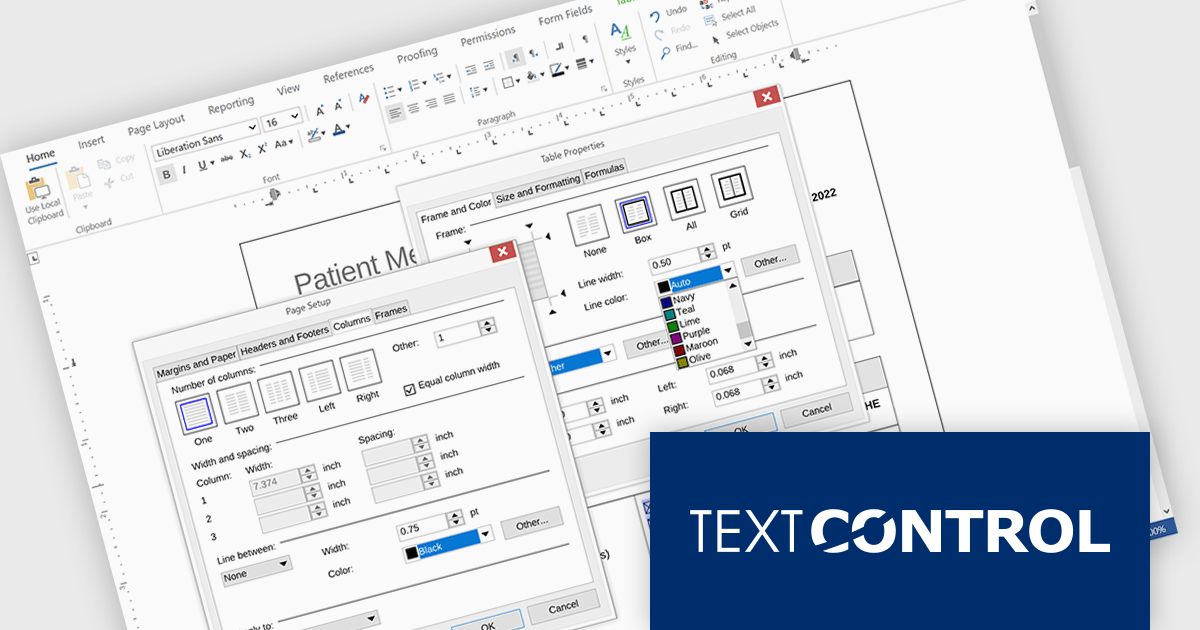
TX Text Control .NET Server for ASP.NET is a server-side component that equips your web applications with a powerful, Microsoft Word-compatible document editor. This allows you to develop applications that generate and edit various document formats (RTF, DOCX, PDF, etc.) on the fly, using data from databases or files. It also boasts features like PDF generation and a browser-based editor with a familiar MS Word-inspired interface, ultimately enhancing the document processing capabilities of your web applications.
The TX Text Control .NET Server for ASP.NET 34.0 release brings full dialog box support to Linux, aligning its functionality with Windows to offer a seamless experience across platforms. Developers building cross-platform applications can now rely on consistent, familiar interfaces for setting table attributes, image properties, and other document-related tasks. This update removes a key limitation for Linux deployments, making it easier to maintain UI consistency and improving the overall usability for end users. By ensuring parity in dialog box functionality, the release simplifies application logic and enhances user interaction across environments.
For a full list of changes in TX Text Control .NET Server for ASP.NET 34.0, see our release notes.
TX Text Control .NET Server for ASP.NET is licensed per developer and is available as a Perpetual License with a 12 month support and maintenance subscription. Run time licenses are required for the deployment to production servers. See our TX Text Control .NET Server for ASP.NET licensing page for full details.
For more information, visit our TX Text Control .NET Server for ASP.NET product page.
Data filtering and grouping in reporting help users organize and analyze information more efficiently by showing only the data that matters most. Filtering refines report results based on specific criteria such as date, category, or value, while grouping arranges related data into clear sections for easier comparison. Together, they improve clarity, speed up analysis, and reveal meaningful patterns. For example, a sales manager can view current quarter transactions grouped by region, or a finance team can review expenses filtered by department for more accurate insights.
Several .NET Blazor reporting controls offer data filtering and grouping including:
For an in-depth analysis of features and price, visit our comparison of .NET Blazor Reporting Controls.
聯繫電話: (888) 850 9911
傳真: +1 770 250 6199


