


官方供應商
我們作為官方授權經銷商,直接提供超過200家開發廠家所發行超過1000個的產品授權給您。
請參閱我們所有的品牌。
Syncfusion Essential Studio Blazor (available as part of Syncfusion Essential Studio Enterprise) is a comprehensive UI component library designed to accelerate the development of high-performance, modern web applications using the Blazor framework. It boasts over 85+ responsive, lightweight, and modular components spanning various categories such as data visualization, data editing, document processing, and interactive UI elements. This rich repertoire empowers developers to rapidly build user-friendly, feature-rich web interfaces, with seamless integration of both server-side and client-side Blazor applications.
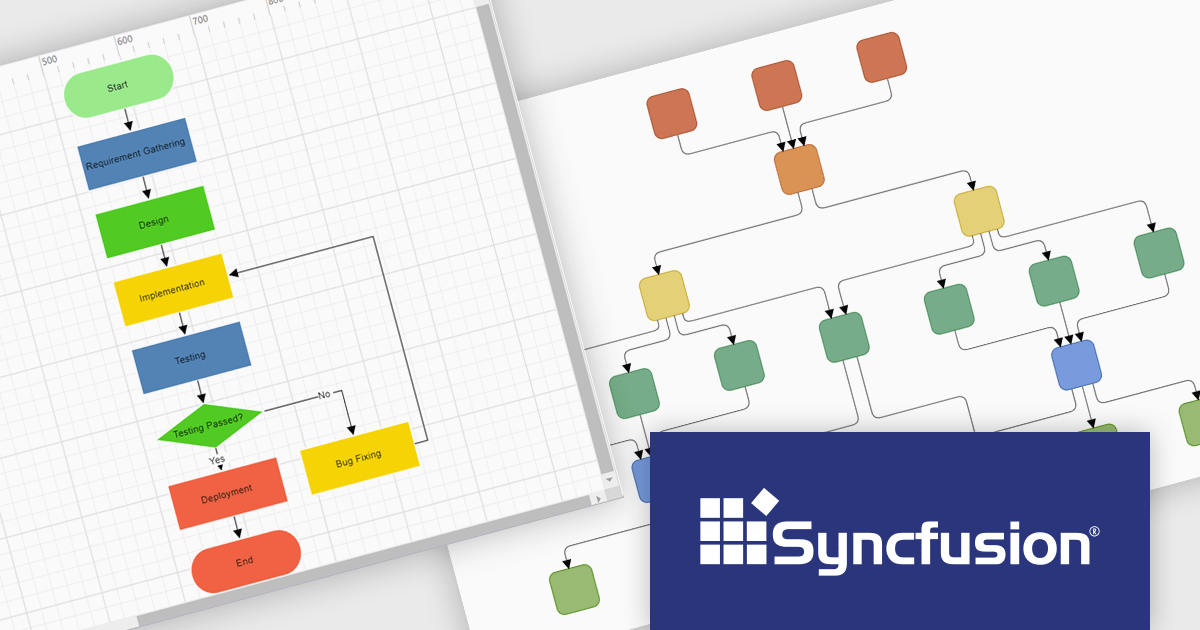
The Syncfusion Essential Studio Enterprise 2024 Volume 3 release introduces the ability to automatically generate clear, logical, and visually appealing flowcharts by arranging nodes and connectors using an advanced layout algorithm. The feature saves time by automating flowchart creation, ensures clarity with logical layouts, enhances visual appeal, and adapts seamlessly to various data inputs, improving overall efficiency.
To see a full list of what's new in 2024 Volume 3, see our release notes.
Syncfusion Essential Studio Blazor is available as part of Syncfusion Essential Studio Enterprise which is licensed per developer starting with a Team License of up to five developers. It is available as a 12 Month Timed Subscription License which includes support and maintenance. See our Syncfusion Essential Studio Enterprise licensing page for full details.
Learn more on our Syncfusion Essential Studio Blazor product page.

The .NET Framework, a comprehensive development platform, has been a cornerstone of Microsoft's ecosystem for over two decades. It provides a rich set of class libraries, tools, and programming languages (like C#, VB.NET, and F#) that enable developers to create a wide range of applications, from desktop software to web services and mobile apps. With the approaching release of .NET 9, Microsoft continues its commitment to delivering a modern, high-performance, and cross-platform development environment.
Microsoft has announced the release of .NET 9 Release Candidate 1. This Microsoft blog post highlights what's new in this release, and includes links to download .NET 9 RC1. The .NET 9 update has a special focus on cloud-native apps and performance, and RC1 has made updates and improvements to many of the elements of .NET 9, including:
For more information, or to download .NET 9 Release Candidate 1, read the official Microsoft blog post about this release.
Spread.NET by MESCIUS is a powerful tool for building Excel-like applications in your .NET projects. It lets you create interactive spreadsheets, grids, dashboards, and even forms within WinForms, ASP.NET, and WPF applications. With its rich feature set, including a robust calculation engine, formula support, and Excel compatibility, Spread.NET empowers developers to build data analysis tools, budgeting apps, scientific dashboards, and more, all within the familiar .NET environment.
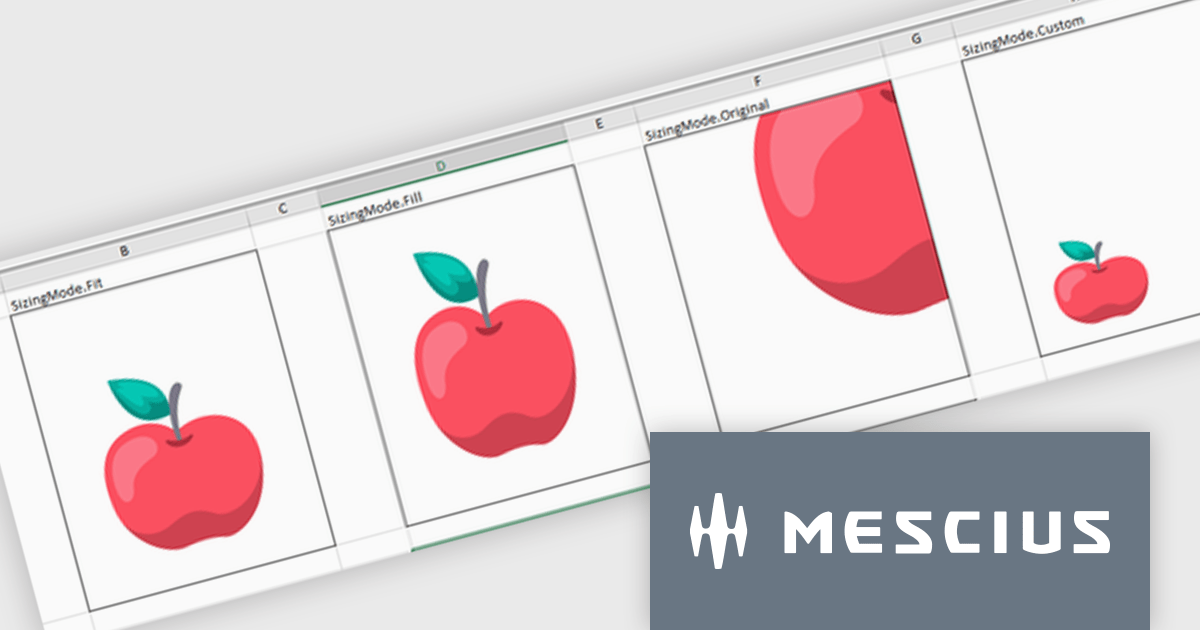
The Spread.NET v17.2 release introduces greater cell image versatility and customization. With four new distinct sizing options—Fit, Fill, Original, and Custom—users gain precise control over how images are displayed within cells. The Fit mode maintains the image's aspect ratio while ensuring it fits within the cell, preventing distortion. The Fill option covers the entire cell, disregarding the aspect ratio for full coverage. Original preserves the image's natural size, even if it exceeds the cell's dimensions, while Custom allows users to set specific height and width parameters. These flexible sizing options enhance the presentation of images, offering tailored solutions to fit various content needs, whether it’s for data visualization, design, or reporting purposes. This feature significantly improves visual control, ensuring consistency and a professional appearance across documents.
To see a full list of what's new in v17.2, see our release notes.
Spread.NET is licensed per developer and is available as a Perpetual License with a 12 month support and maintenance subscription. We can supply any Spread.NET license including new licenses, maintenance renewals, and upgrade licenses. See our Spread.NET licensing page for full details.
For more information, visit our Spread.NET product page.
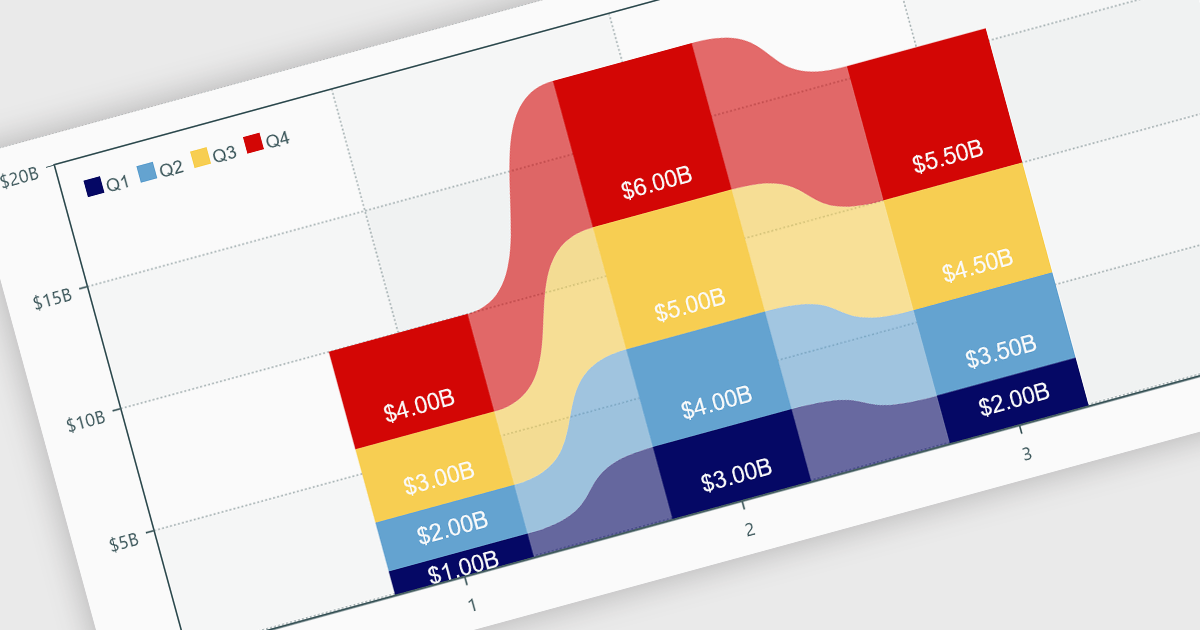
Charts within reports are graphical representations of data that allow users to visually interpret trends, comparisons, and patterns. They can take various forms, such as bar charts, line charts, or pie charts, and are typically integrated into dashboards or reporting tools to provide clear insights at a glance. By simplifying data visualization, charts enhance user experience and make it less taxing for users to understand complex information. Charts can be dynamically updated with real-time data, allowing for more responsive and insightful reporting in applications.
Several .NET WPF reporting controls offer support for charts including:
For an in-depth analysis of features and price, visit our comparison of .NET WPF Reporting controls.

jQWidgets is a comprehensive JavaScript UI framework offering a robust collection of over 60 widgets, themes, and utilities for building professional-grade, cross-platform web applications. Built on jQuery, HTML5, and CSS, it provides extensive functionality including data grids, charts, navigation, input validation, and more. jQWidgets simplifies web development, ensuring your applications work seamlessly across desktop browsers, tablets, and smartphones.
The jQWidgets v20.0.0 release introduces AI-powered sentence completion in its input component, enhancing user efficiency by suggesting autocompletions for full sentences based on context and how it has been configured.
To see a full list of what's new in v20.0.0, see our release notes.
jQWidgets is licensed per developer and is available as a Perpetual license 1 year support and maintenance. See our jQWidgets licensing page for full details.
Learn more on our jQWidgets product page.
聯繫電話: (888) 850 9911
傳真: +1 770 250 6199


