


官方供應商
我們作為官方授權經銷商,直接提供超過200家開發廠家所發行超過1000個的產品授權給您。
請參閱我們所有的品牌。
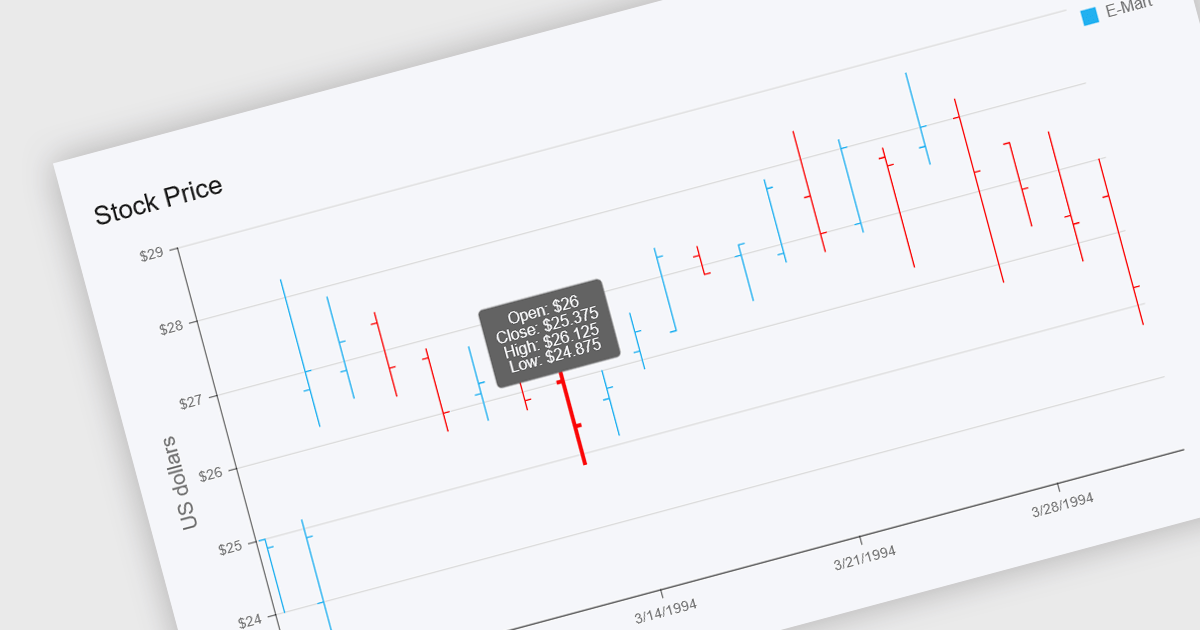
OHLC charts, short for Open-High-Low-Close charts, are a type of financial chart used to represent price movements of assets over a specific time period. Each point on the chart summarizes a single period's opening, highest, lowest, and closing prices, typically displayed using vertical bars with ticks to indicate opening and closing values. This format offers a clear and compact way to visualize volatility and market trends within a given timeframe. For developers and analysts working with financial data, OHLC charts are especially valuable for identifying price patterns, monitoring market behavior, and making informed decisions based on historical performance.
Several .NET chart components offer OHLC charts, including:
For an in-depth analysis of features and price, visit our comparison of .NET chart components.
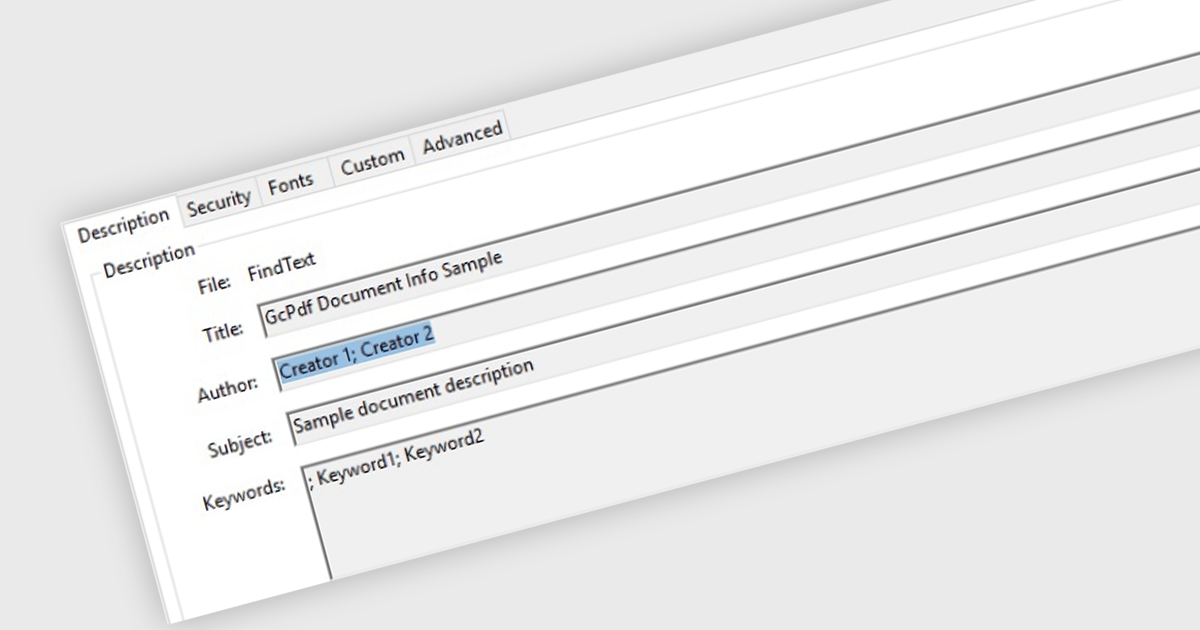
Managing Metadata in the context of PDF Viewer components for ASP.NET Core, refers to the ability to view, edit, and update the descriptive information embedded within a PDF file. This metadata typically includes details such as the document's title, author, subject, keywords, creation and modification dates, and application used to create the file. Managing metadata allows developers and end users to keep document properties accurate and relevant, which can be important for document indexing, searching, and compliance with organizational standards. This feature is especially useful in document management systems where accurate metadata supports efficient retrieval and categorization.
Several PDF Viewer ASP.NET Core components offer metadata management features including:
For an in-depth analysis of features and price, visit our comparison of ASP.NET Core PDF Viewer Components.
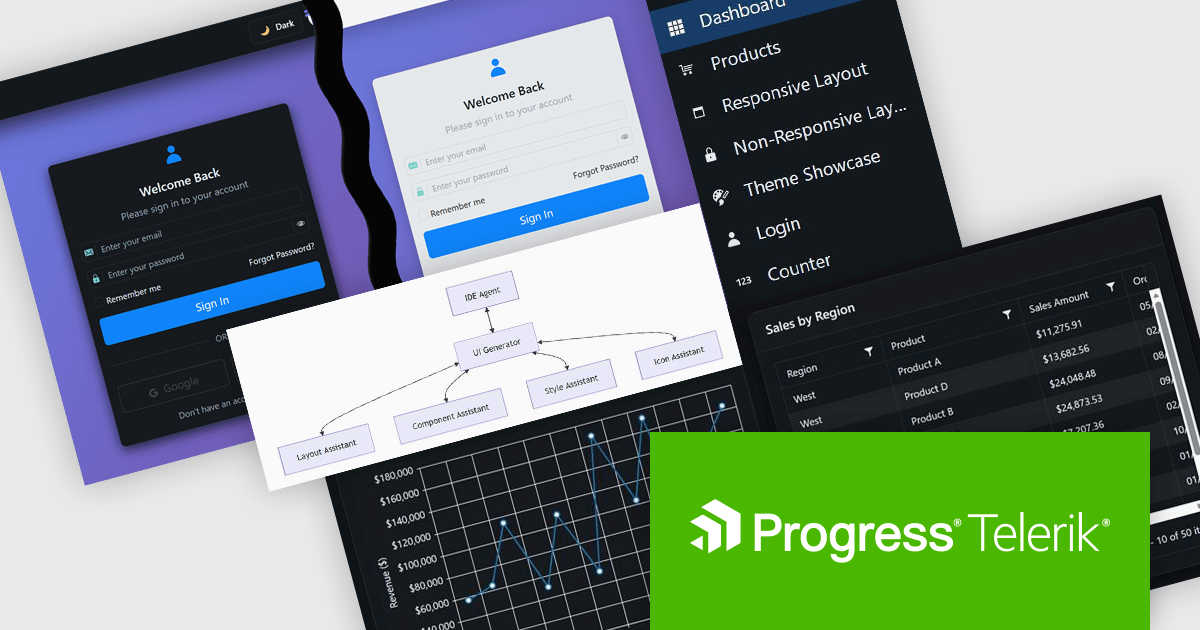
DevCraft by Telerik is a comprehensive AI-powered suite of more than 1,250 UI components and development tools designed for building modern web, desktop, and mobile applications using .NET and JavaScript frameworks. It includes reporting and report management solutions, automated testing and mocking tools, and document processing libraries, as well as a wide range of professionally designed user interface controls from the Telerik and Kendo UI suites. DevCraft enables developers to create feature-rich, high-performance applications with consistent design and user experience, delivering enterprise-level, scalable, and maintainable software solutions.
The Telerik DevCraft 2025 Q4 update adds the Agentic UI Generator which enables developers to translate natural language prompts directly into fully‑scaffolded, production‑ready user interfaces built on the Telerik and Kendo UI component libraries. It includes all the functionality of the AI Coding Assistant, as well as handling layouts, styling, responsive behavior, accessibility best‑practices, data‑bindings and theming from an MCP server that works in any AI-enabled IDE, so developers can remain in their familiar IDE and focus their effort on domain logic rather than boilerplate. This feature is only available as part of DevCraft Complete and DevCraft Ultimate subscription licenses and currently supports Blazor, Angular and React.
To see a full list of what's new in DevCraft 2025 Q4, see our release notes.
Telerik DevCraft is licensed per developer and has two licensing models: an annual Subscription License and a Perpetual License. The Subscription license provides access to the latest product updates, technical support, and exclusive benefits for a flat annual fee, and must be renewed to continue using the software. The Perpetual license is a one-time purchase granting access to the current released version and includes a one-year subscription for product updates and technical support. After this initial period, users can choose to renew the subscription element to continue receiving updates and support; otherwise, they may continue using the installed version available during their active subscription term but will forgo future updates and support. See our Telerik DevCraft Ultimate licensing page for full details.
For more information, see our product pages:
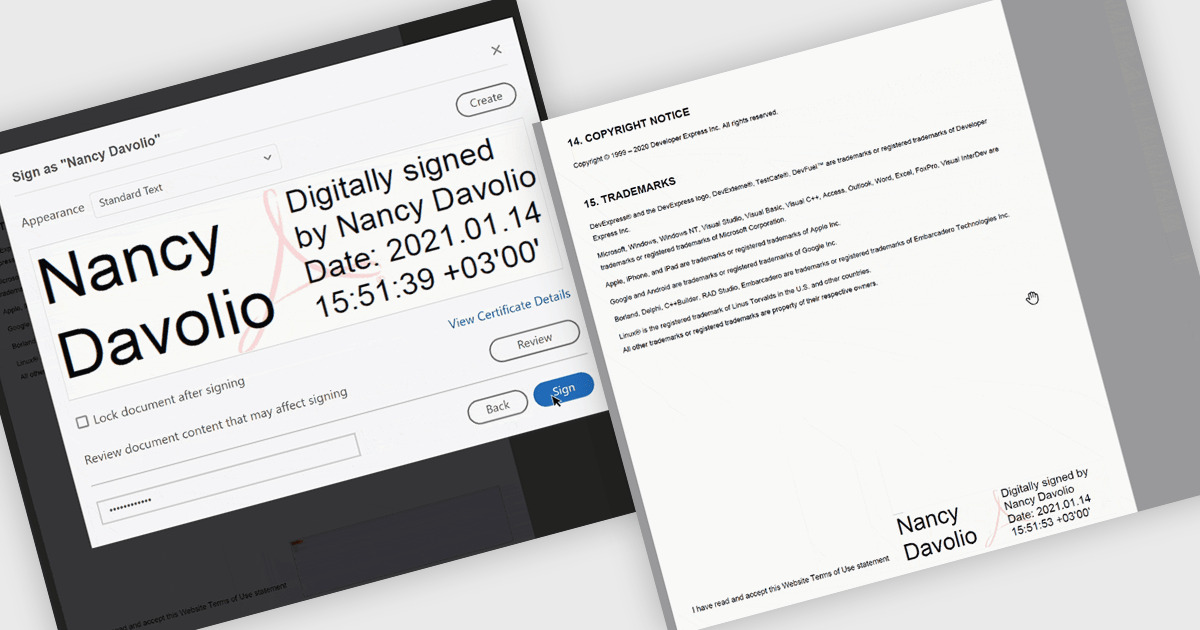
PDF visual signatures allow you to embed a clear, on-page representation of a digital signature directly into your exported reports, combining the security of a certified digital signature with the clarity of a visibly signed document. This feature instantly communicates authenticity and approval, helping recipients quickly verify who signed the report without navigating hidden metadata. It enhances professionalism with styled signature blocks that can include names, titles, dates, or branding elements, reinforcing trust and consistency across all distributed documents. Common use cases include signed invoices, compliance reports, approval forms, contracts, certificates, and any document that requires both a secure digital signature and a visually identifiable sign-off for clarity and reassurance.
Several .NET Reporting controls offer PDF visual signature support including:
For an in-depth analysis of features and price, visit our .NET Reporting controls comparison.
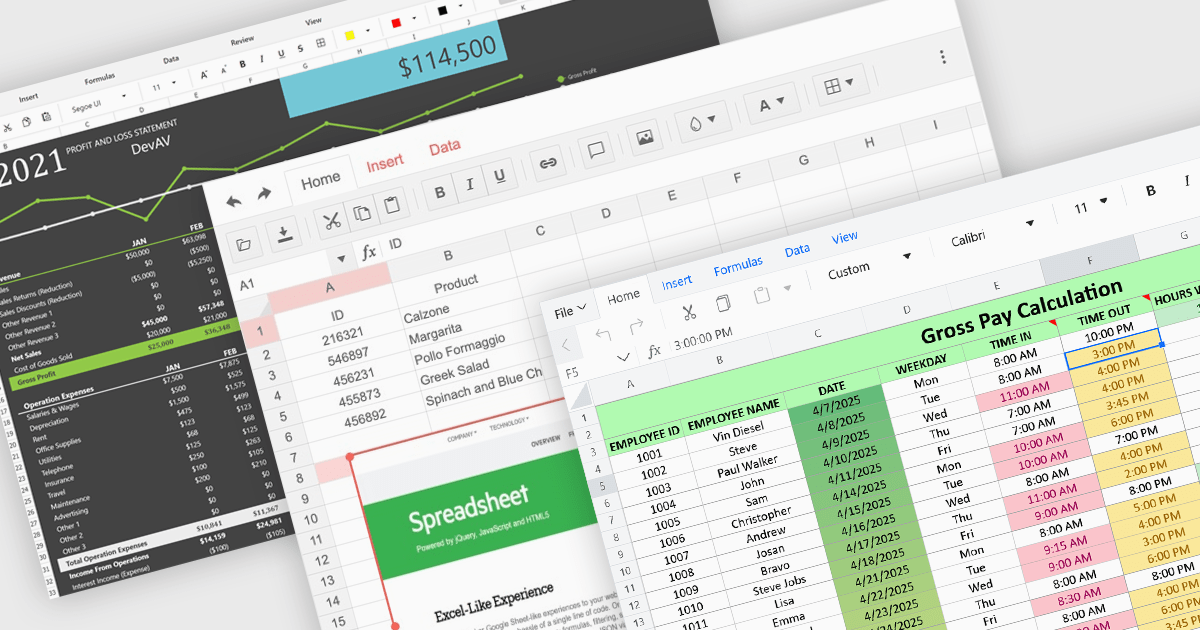
Formatting and presentation features shape how information is communicated within a spreadsheet, turning raw values into content that is clearer, more readable, and visually consistent. These capabilities help users emphasize key data, establish a coherent visual style, and create worksheets that are easier to interpret at a glance. By supporting both subtle adjustments and more expressive enhancements, they play a central role in making spreadsheets suitable for reporting, analysis, and presentation-focused tasks across a wide range of scenarios.
Common features include:
For an in-depth analysis of features and price, visit our ASP.NET Core spreadsheet components comparison.
聯繫電話: (888) 850 9911
傳真: +1 770 250 6199


