


官方供應商
我們作為官方授權經銷商,直接提供超過200家開發廠家所發行超過1000個的產品授權給您。
請參閱我們所有的品牌。
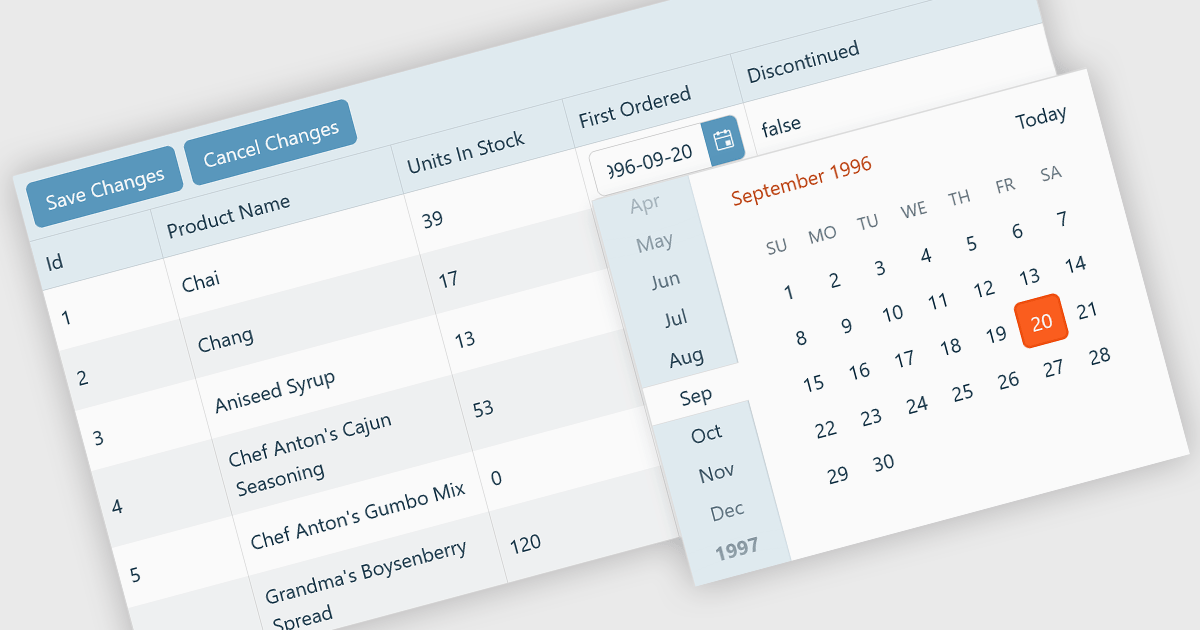
A custom grid editor allows developers to tailor how users interact with data directly within grid cells, providing a flexible and efficient editing experience. Instead of relying on standard text inputs, custom editors can include dropdowns, sliders, toggles, or calendar components to match the data type. This approach not only improves data entry and validation but also enhances accuracy and user satisfaction by ensuring inputs are contextually relevant. For example, a date field might use an inline date picker, while a status column could feature a dropdown with predefined options. Ideal for data-heavy applications such as dashboards, scheduling tools, and administrative panels, custom grid editors help users to edit complex data quickly and intuitively without leaving the main interface.
Several React Grid controls offer support for custom editing including:
For an in-depth analysis of features and price, visit our comparison of React Grid controls.
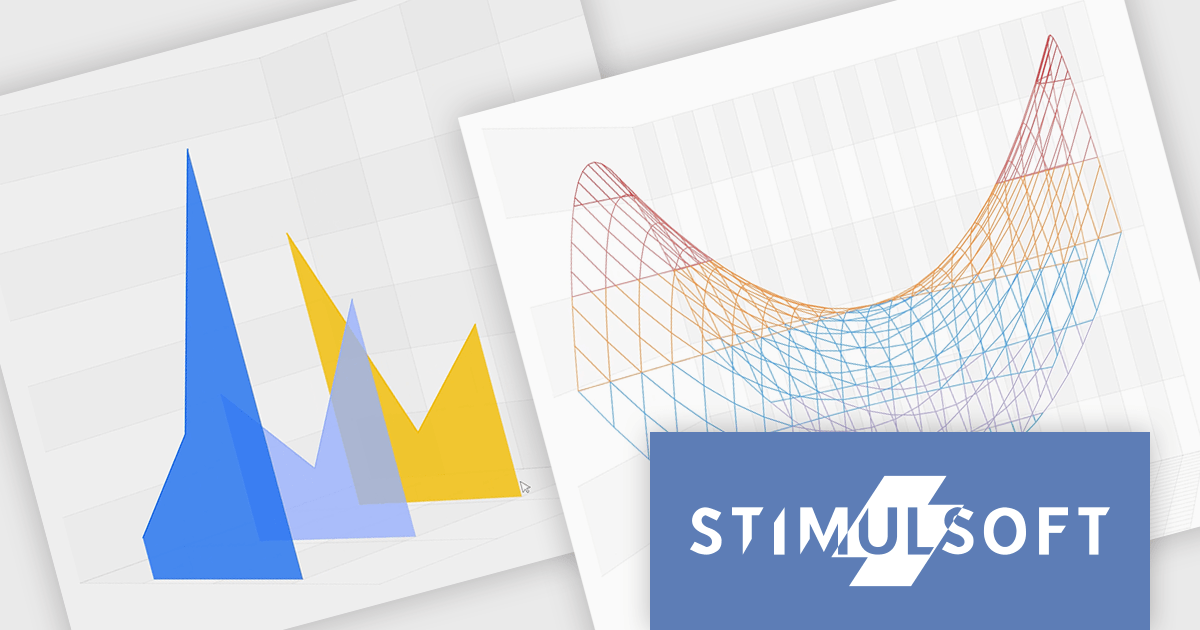
Stimulsoft Reports.JS provides a robust reporting toolkit designed specifically for JavaScript applications. This library leverages a client-side architecture, offering a pure JavaScript report engine for efficient report rendering directly within web browsers. The solution includes a user-friendly report designer for building reports with various data sources and visualizations, along with a report viewer for seamless integration and display within your JavaScript applications. This eliminates the need for server-side dependencies or browser plugins, simplifying the development process for embedding powerful reporting functionalities into your web projects.
The Stimulsoft Reports.JS 2025.4.1 update introduces new 3D Surface and Area charts that enhance data visualization capabilities in reports and dashboards. These charts allow developers to represent complex data relationships with added depth and perspective, improving analytical clarity and user comprehension. By visualizing three-dimensional data and trends more effectively, developers can deliver more informative and visually engaging reporting solutions without additional complexity in implementation.
To see a full list of what's new in 2025.4.1, see our release notes.
Stimulsoft Reports.JS is licensed per developer and is available as a Perpetual license with 1 year support and maintenance. See our Stimulsoft Reports.JS licensing page for full details.
Stimulsoft Reports.JS is available individually or as part of Stimulsoft Ultimate.
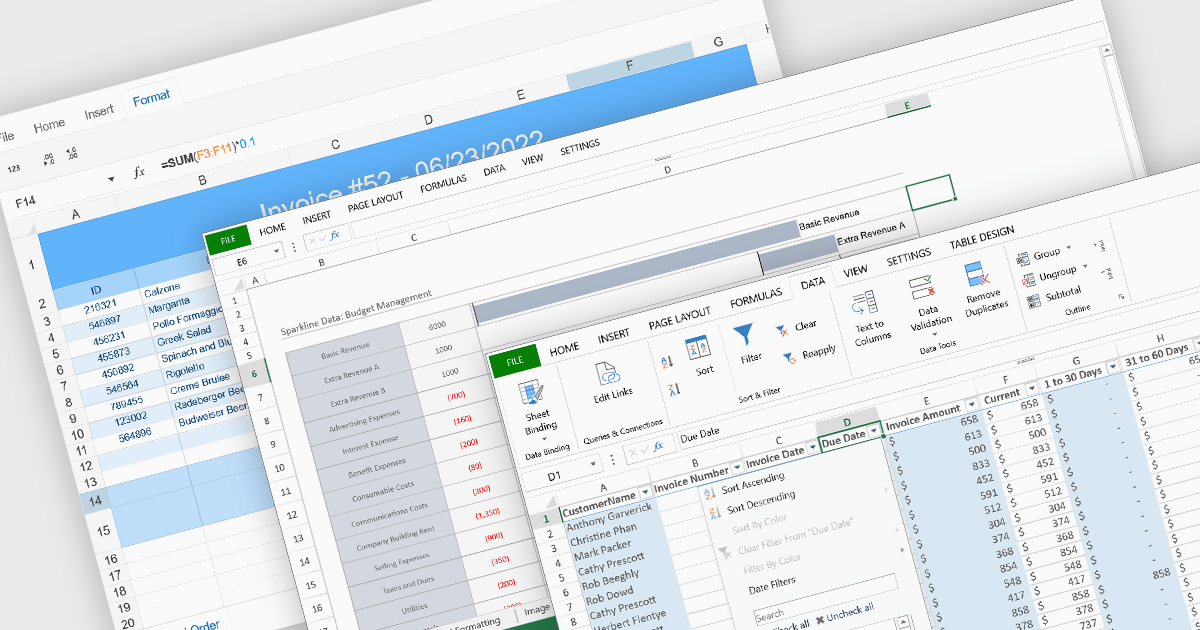
Data organization and analysis features form the backbone of a spreadsheet’s ability to transform raw inputs into meaningful insights. These capabilities go beyond simple data entry, providing the tools necessary to structure, manipulate, and interpret information effectively. By supporting both everyday tasks and complex analytical processes, they enable users to manage datasets of varying scale and complexity while ensuring that information remains accessible and actionable. Well-implemented organization and analysis features allow spreadsheets to serve not only as data storage tools but also as powerful environments for decision-making and reporting.
Common features include:
For an in-depth analysis of features and price, visit our React spreadsheet components comparison.
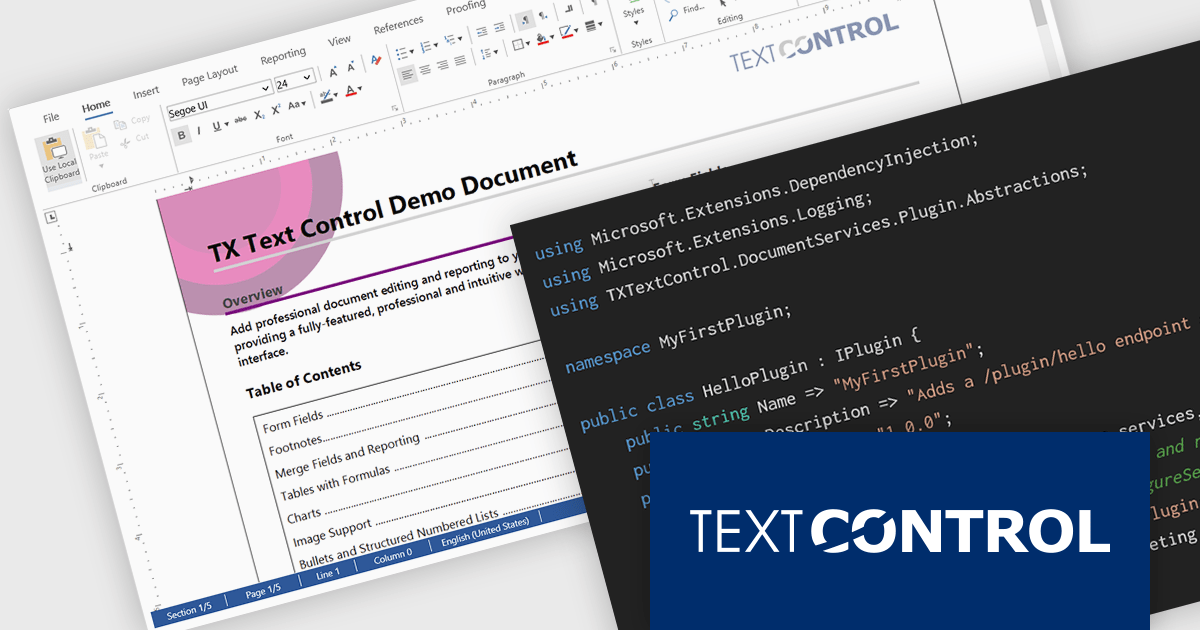
DS Server by Text Control is a powerful document processing backend designed to integrate seamlessly into web applications, providing developers with a robust set of APIs for creating, editing, viewing, and converting documents. Built for scalability and security, DS Server allows organizations to automate document workflows within their own infrastructure or cloud environments, eliminating the need for external dependencies. With support for popular formats like DOCX, PDF, and HTML, it enables rich document capabilities while maintaining full control over data and compliance. Whether you're generating dynamic reports, creating user-editable templates, or embedding secure document viewers, DS Server delivers high-performance document services tailored to modern application needs.
The DS Server 4.1.0 updated introduces a robust plug-in architecture that enables developers to extend the server’s core capabilities by injecting custom middleware, registering services, and integrating with APIs and the UI. Designed for easy deployment, plug-ins can be dropped into a dedicated folder and auto-loaded without altering the base system. Whether you're handling document conversion, templating, or workflow automation, the new plug-in architecture allows you to tailor DS Server’s behavior to match your application’s exact requirements.
To see a full list of what's new in version 4.1.0, see our release notes.
Text Control DS Server is licensed per server and is available as an Annual License that includes software updates. See our Text Control DS Server licensing page for full details.
For more information, visit our Text Control DS Server product page.
SurveyJS Survey Creator is a JavaScript library that enables developers to embed a drag-and-drop survey and form builder directly within their web applications. It provides a comprehensive UI for designing surveys with various question types, logic branching, and layout customization, generating JSON schemas that can be used by the SurveyJS Survey Library to render and process the surveys. This allows for the creation of dynamic and user-configurable data collection tools without requiring extensive custom development, streamlining the process of integrating survey functionality into applications.
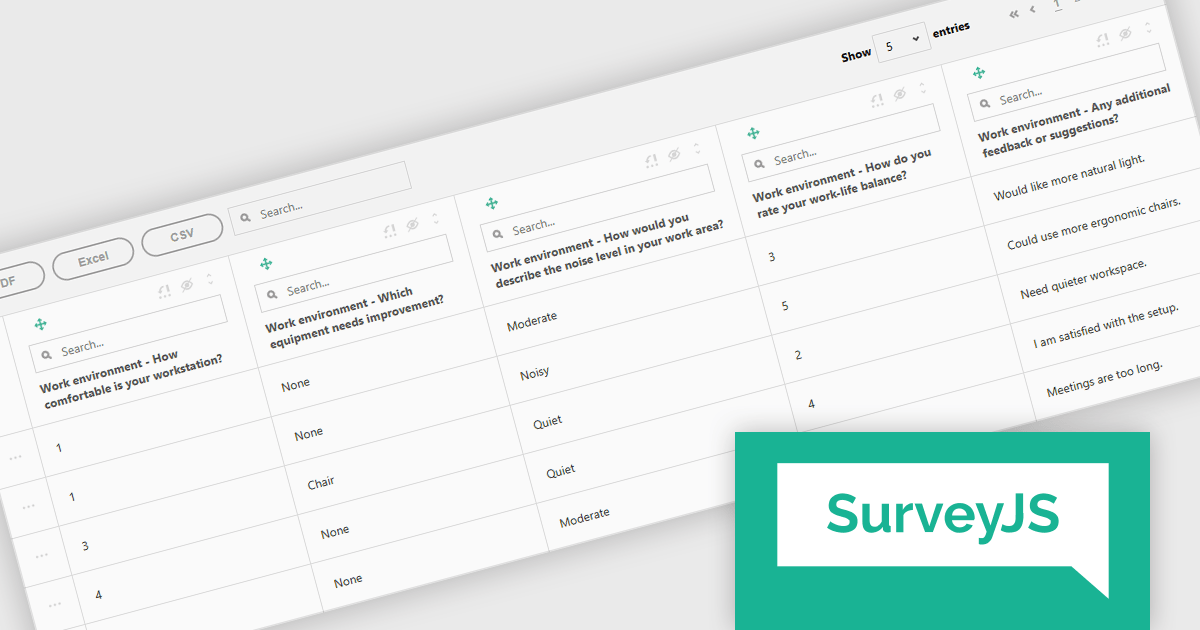
The SurveyJS Survey Creator 2.3.9 update introduces support for specialized and composite question types within the Table View, enabling developers to efficiently display and analyze complex survey structures in a unified interface. This enhancement allows multiple question types such as numeric ratings, text responses, and categorical selections to be reviewed side by side, improving clarity and reducing the need for manual data consolidation. By supporting composite questions, the update simplifies the process of working with interrelated data points, helping developers deliver accurate reporting and improving survey analysis.
To see a full list of what's new in version 2.3.9, see our release notes.
SurveyJS Survey Creator is licensed per developer with a one-time payment for indefinite use. Access to updates and technical support is available through a subscription. See our SurveyJS Survey Creator licensing page for full details.
Learn more on our SurveyJS Survey Creator product page.
聯繫電話: (888) 850 9911
傳真: +1 770 250 6199


