


官方供應商
我們作為官方授權經銷商,直接提供超過200家開發廠家所發行超過1000個的產品授權給您。
請參閱我們所有的品牌。
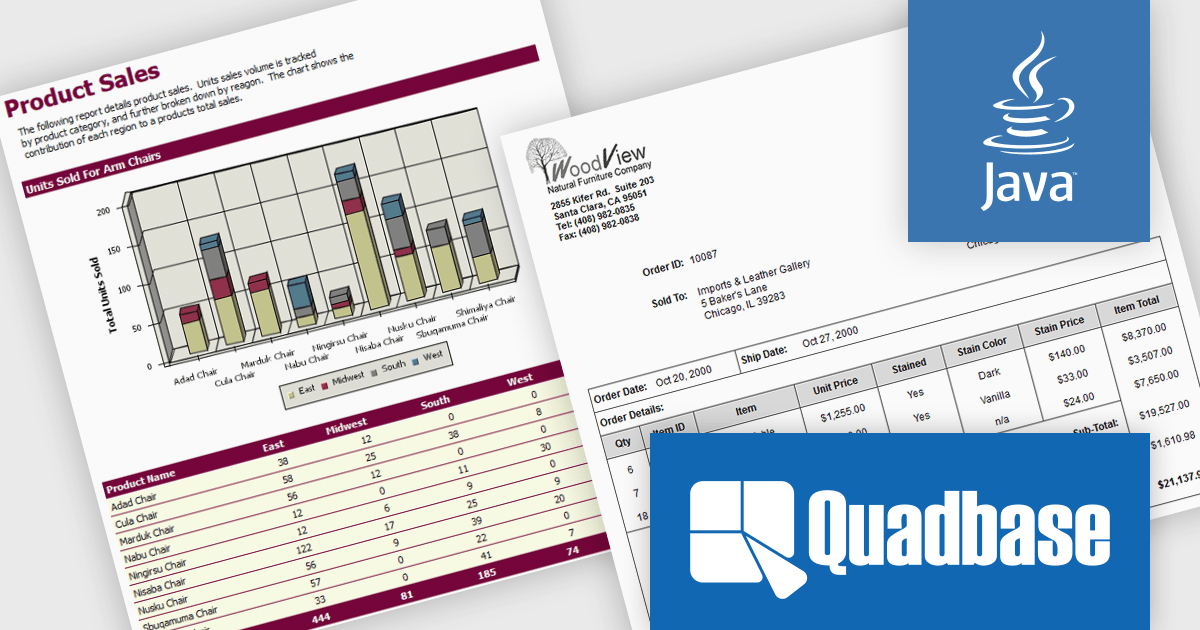
EspressReport by Quadbase Systems is a robust Java-based reporting and business intelligence solution designed for integration into applications, servlets, and JSP environments. With a comprehensive visual report designer and a rich API toolkit, EspressReport enables users to create dynamic and interactive reports tailored to enterprise needs. Its cross-platform compatibility makes it a flexible choice for organizations operating across a variety of system environments, including Windows, Linux, macOS, and Unix.
EspressReport offers a powerful set of features that support versatile data connectivity, advanced charting capabilities, and a wide range of output formats such as PDF, Excel, and HTML. Users benefit from intuitive visual design tools, multi-source data integration, and customizable report parameters, making it suitable for both technical developers and business users. Common use cases include financial reporting, operational reports, data visualization, and scheduled report distribution, helping organizations transform raw data into clear, actionable insights.
EspressReport is available as either a Development License or a Server/Deployment License. The Development License allows one developer to install and use the design tools on a single machine for development purposes. It does not permit any deployment or distribution of applications. The Server/Deployment License, is designed for running EspressReport-based solutions in server environments, including applications, servlets, and JSPs, and is priced per server CPU. Licenses come with Annual Support & Maintenance for email/phone support, patches, and upgrades. See our EspressReport licensing page for full details.
For more information visit our EspressReport product page.
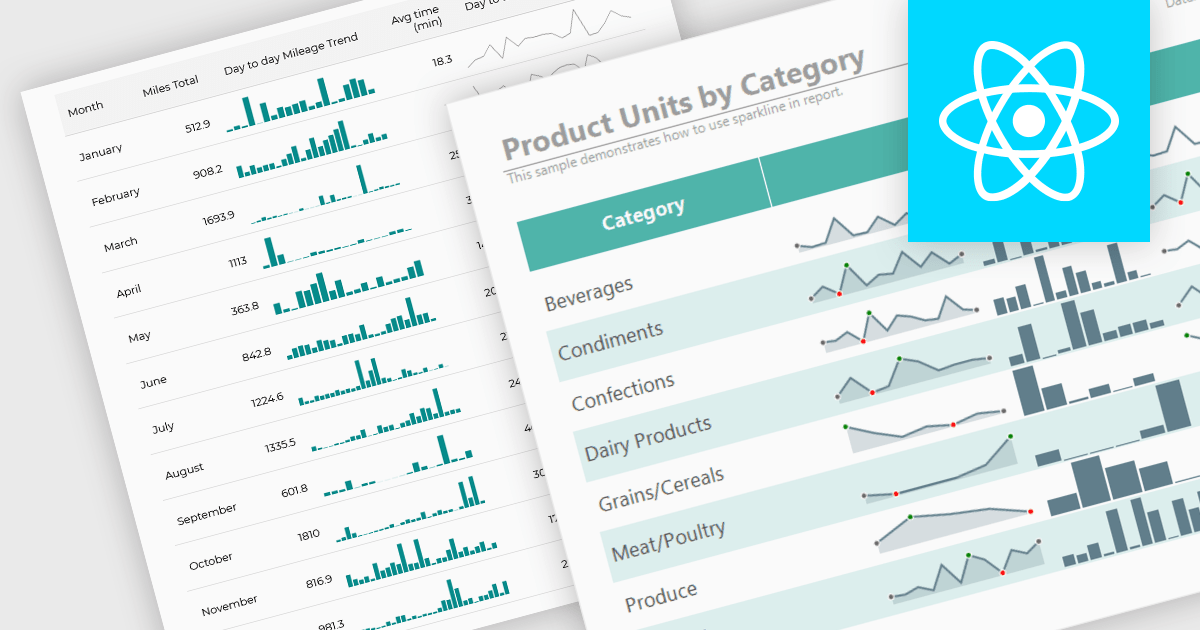
Sparklines are compact, data-rich graphics embedded within reports to illustrate trends, variations, or patterns over time. These miniature charts, typically rendered as lines, columns, or bars, offer a concise visual summary without the need for full-scale graphs. By integrating sparklines directly into data tables or summaries, reporting tools enable users to quickly grasp performance metrics or fluctuations at a glance, enhancing the interpretability of complex datasets.
Several React reporting controls offer sparklines including:
For an in-depth analysis of features and price, visit our React reporting controls comparison.
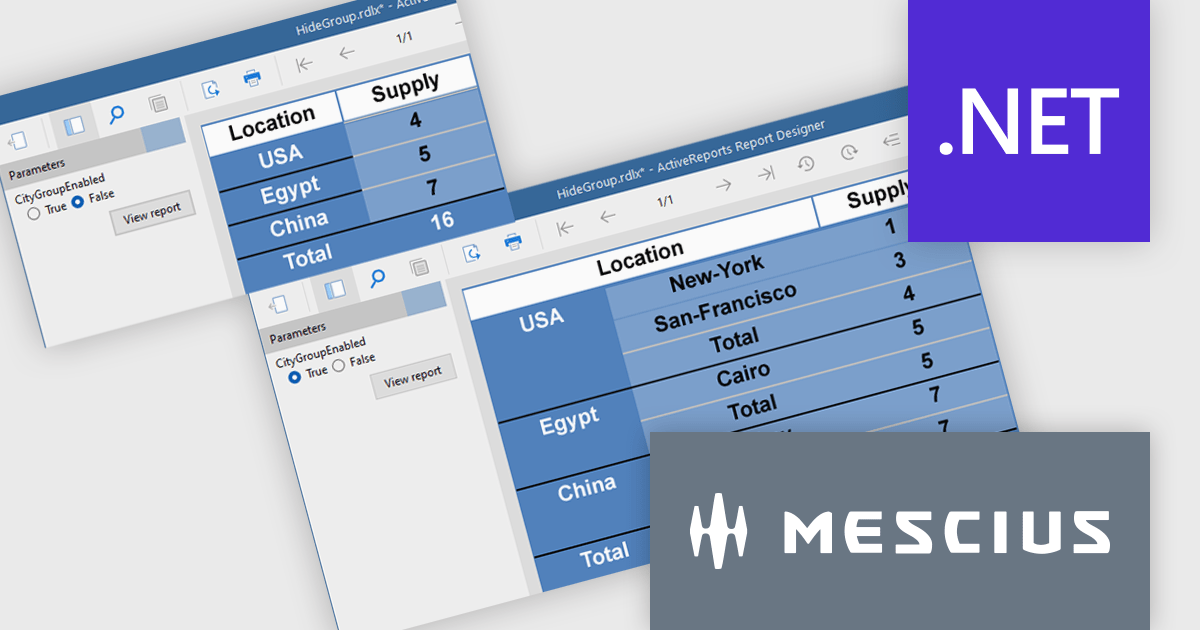
ActiveReports.NET from MESCIUS, is a comprehensive reporting solution for developers building applications in .NET. It empowers you to design and deliver visually appealing reports through user-friendly designers and a wide range of controls. ActiveReports simplifies report creation and distribution with a versatile API, rich data source connectivity, and support for multiple export formats. This translates to increased developer productivity and improved end-user experience with powerful reporting functionalities within your .NET applications.
The ActiveReports v19.1 update introduces enhanced grouping control that allows developers to enable or hide groups in Tables, BandedLists, and Tablix controls based on expressions or parameters. This capability makes it easier to design reports that adapt at runtime to different data scenarios or user inputs, without requiring code changes. By configuring the new "Enabled" and "Hidden" properties directly within the report definition, developers can deliver more flexible and maintainable reporting solutions that respond dynamically to business logic.
To see a full list of what's new in v19.1, see our release notes.
ActiveReports.NET is licensed per developer and is available with or without a 12 month support and maintenance subscription. See our ActiveReports.NET licensing page for full details.
Learn more on our ActiveReports.NET product page.
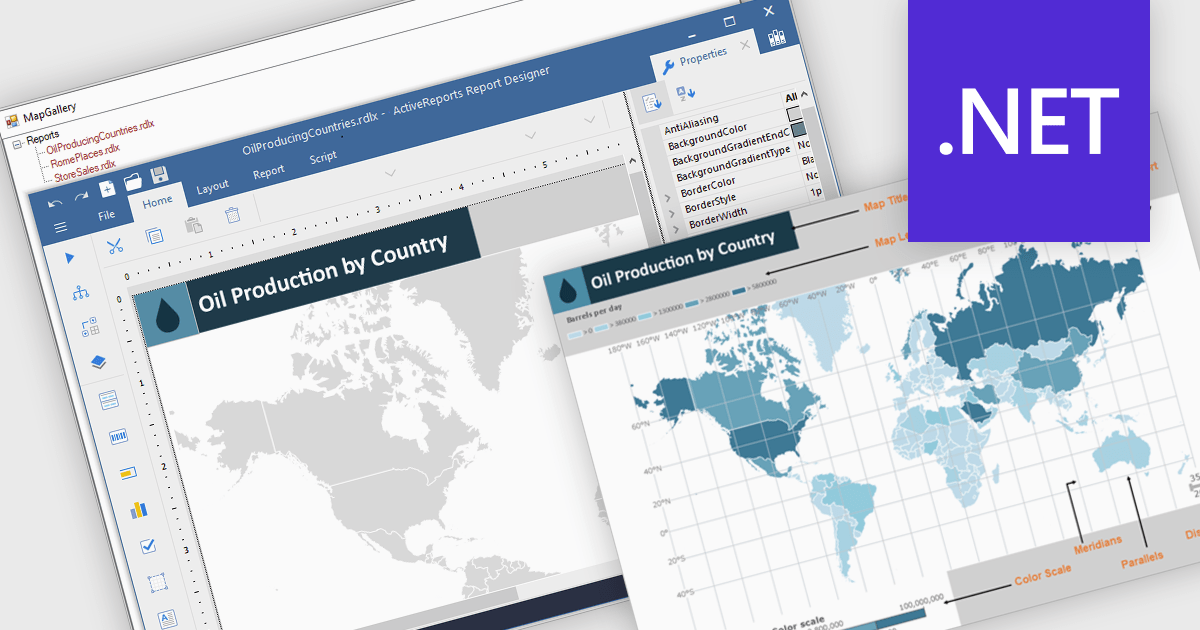
Maps in reports are visual tools that display geographic data, allowing users to see where activities, trends, or values occur across specific regions. By translating complex location-based information into clear and intuitive visuals, maps enhance understanding, highlight spatial patterns, and reveal insights that might be missed in tables or charts. This added layer of geographic context supports more informed decision-making and more compelling data storytelling. Common use cases include tracking regional sales performance, mapping customer distribution, analyzing service coverage, and presenting market expansion opportunities. Whether static or interactive, maps make reports more engaging and impactful for both technical and non-technical audiences.
Several .NET reporting controls offer maps, including:
For an in-depth analysis of features and price, visit our comparison of .NET reporting controls.

ComponentOne WinUI and MAUI Edition is a comprehensive suite of UI components designed for cross-platform .NET development, supporting WinUI, MAUI, UWP, and Xamarin with a single license. It empowers developers to create modern and high-performance applications for business and enterprise use. With versatile controls and seamless integration, the suite simplifies the development process, enhances productivity, and ensures compatibility with the latest .NET platforms, making it an essential tool for delivering exceptional user experiences.
The ComponentOne Studio WinUI & MAUI Edition 2025 v1 update introduces support for FlexViewer and FlexReport in WinUI, enabling developers to seamlessly embed advanced reporting functionality directly into their Windows 11 (WinUI 3.0) applications. With this update, developers can now display FlexReports, SQL Server Reporting Services (SSRS) reports, and PDF documents within a single viewer control, improving document handling and enhancing the end-user experience. FlexReport’s support for .NET Standard further improves cross-platform compatibility, allowing for consistent report generation and rendering across different .NET environments. This release simplifies the development of data-driven desktop applications by providing a reliable and fully integrated reporting solution built specifically for modern Windows UI frameworks.
To see a full list of what's new in 2025 v1, see our release notes.
ComponentOne Studio WinUI and MAUI is licensed per developer on a perpetual basis and includes a 12 month subscription. See our ComponentOne Studio WinUI and MAUI licensing page for full details.
Learn more on our ComponentOne Studio WinUI and MAUI product page.
聯繫電話: (888) 850 9911
傳真: +1 770 250 6199


