


官方供應商
我們作為官方授權經銷商,直接提供超過200家開發廠家所發行超過1000個的產品授權給您。
請參閱我們所有的品牌。
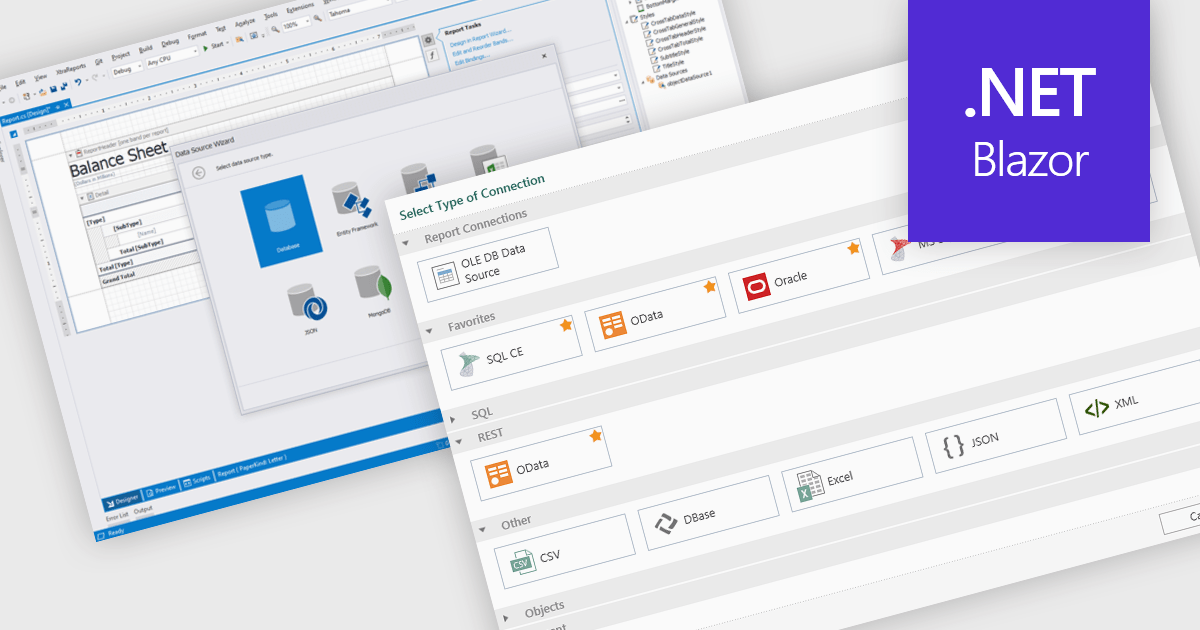
Data connectivity is a foundational aspect of modern reporting components, enabling applications to retrieve and present data from a wide variety of sources. Whether integrating with relational databases, cloud services, or flat files, effective data connectivity ensures that reports reflect current, accurate information. Reporting components are designed to abstract the complexity of accessing these data sources, providing developers with flexible APIs and tools to bind data into visualizations and formatted reports.
Common features include:
For an in-depth analysis of features and price, visit our Blazor reporting components comparison.
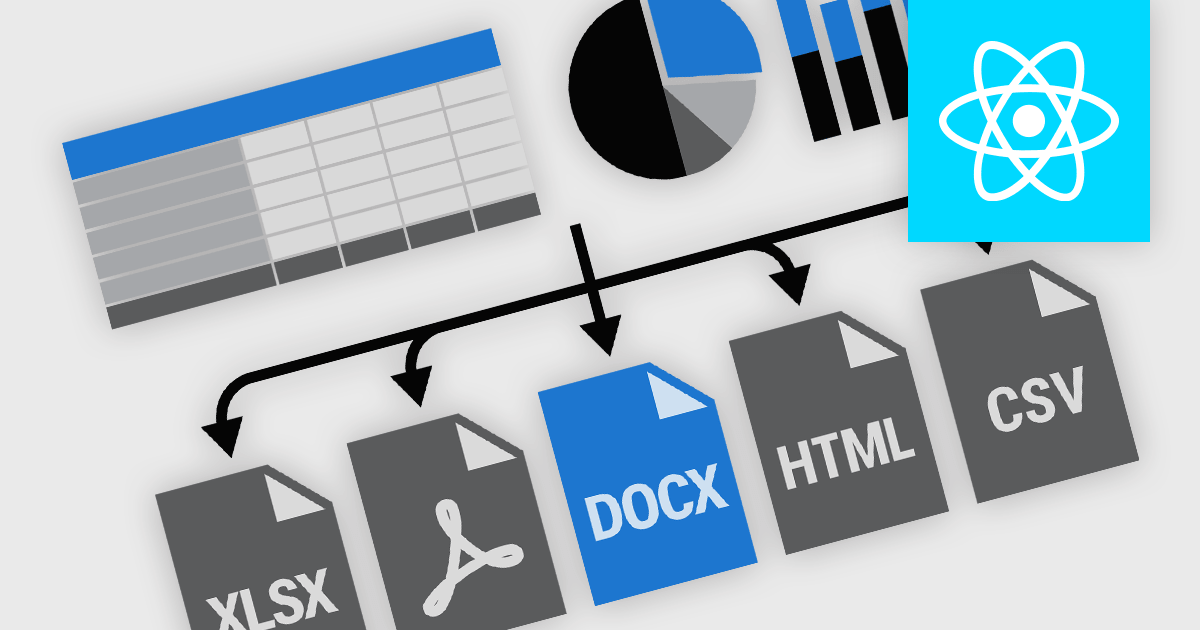
Exporting and printing functionality in reporting components is a core requirement for many software applications, particularly those used in business, finance, and analytics. These capabilities enable users to transform dynamic, on-screen reports into portable or hard-copy formats suitable for distribution, archiving, or further processing. High-performance reporting tools offer flexible export and print options to accommodate various workflows, whether for regulatory compliance, client communications, or internal documentation. Support for a broad range of output formats ensures that users can interact with report content in the way that best suits their needs.
Common features include:
For an in-depth analysis of features and price, visit our React reporting components comparison.
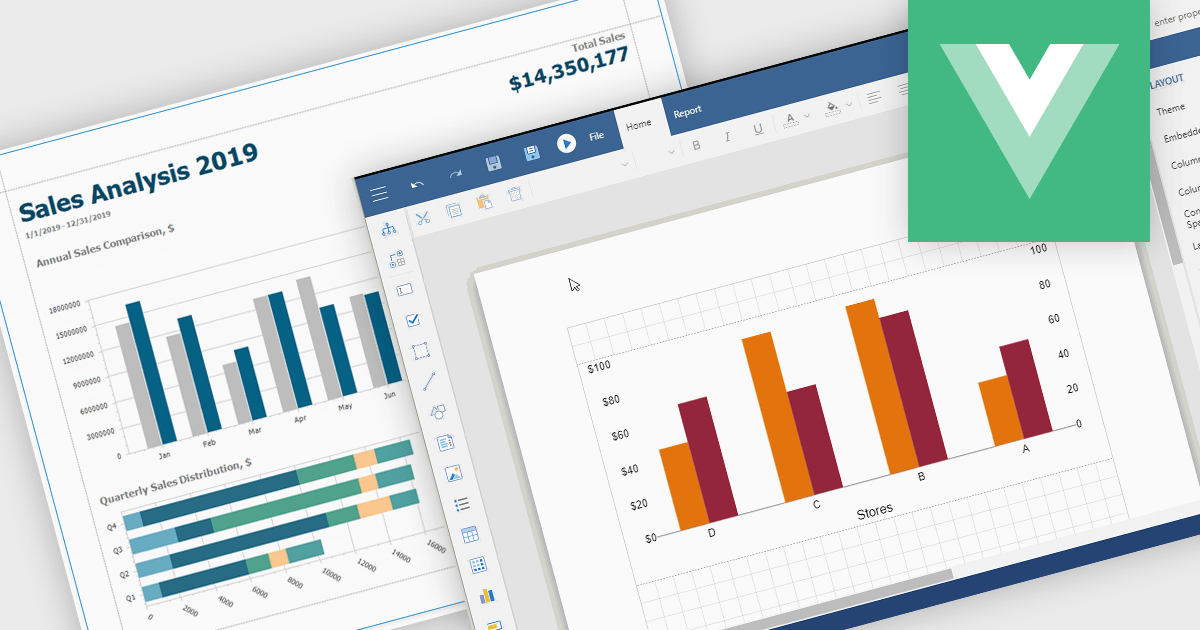
Charts in reports are graphical representations of data such as bar graphs, line charts and pie diagrams that are incorporated into business documents to illustrate key insights and trends at a glance. By converting numbers into intuitive visuals, charts improve clarity and make comparisons between categories or time periods effortless while drawing attention to critical metrics like sales growth, customer churn or budget variances. These visual tools streamline data interpretation, empower stakeholders to make faster more informed decisions, foster alignment across departments and tell a cohesive data driven story without wading through rows of figures.
Several Vue.js reporting components support charts including:
For an in-depth analysis of features and price, visit our Vue.js Reporting Components comparison.
FastReport Online Designer is a cross platform visual report designer for FastReport .NET that enables users to create, edit and view reports on any device running Android, iOS or Windows through a modern web browser on computers, tablets, smartphones, game consoles or TV sets. Common use cases include remote collaboration on operational dashboards, embedding interactive reporting in web applications and empowering business users to customize and share up to date analyses without installing additional software.
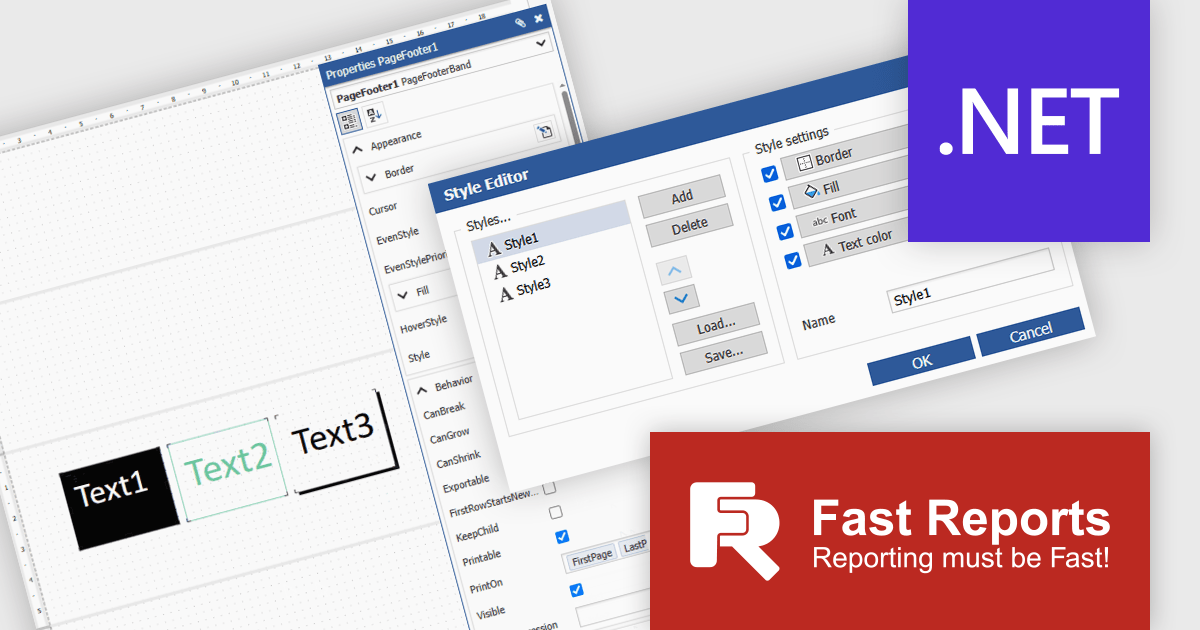
FastReport Online Designer 2025.2 introduces a new style editor that enables users to define and manage report styles in one place. By allowing customization of fill colors, fonts, borders, and more, the feature removes the need for repetitive manual formatting. Users can now create a single style and apply it across multiple components, ensuring visual consistency and reducing formatting time.
To see a full list of what's new in v2025.2, see our release notes.
FastReport Online Designer is available as a license option in the FastReport .NET Components Packages. It is included in FastReport Ultimate .NET and FastReport Web .NET. See our FastReport Online Designer licensing page for full details.
For more information, see our FastReport Online Designer product page.
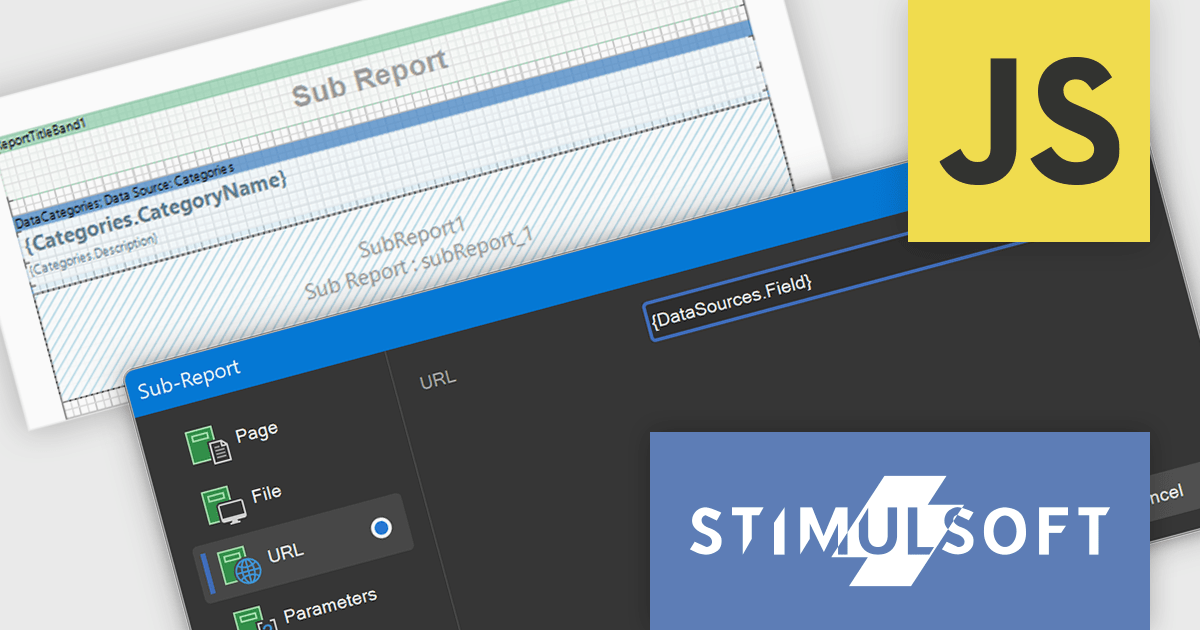
Stimulsoft Reports.JS provides a robust reporting toolkit designed specifically for JavaScript applications. This library leverages a client-side architecture, offering a pure JavaScript report engine for efficient report rendering directly within web browsers. The solution includes a user-friendly report designer for building reports with various data sources and visualizations, along with a report viewer for seamless integration and display within your JavaScript applications. This eliminates the need for server-side dependencies or browser plugins, simplifying the development process for embedding powerful reporting functionalities into your web projects.
The Stimulsoft Reports.JS includes expressions within the URL and File fields of the Sub-Report component. This functionality helps developers to dynamically determine the source of a sub-report, whether it is a file path or a web address, based on the evaluation of expressions. Consequently, this allows for the creation of more adaptable and context-aware reports where the embedded sub-report content or linked resources are determined programmatically based on the main report's data, offering greater flexibility in report design and data integration without the need for static configurations.
Stimulsoft Reports.JS is licensed per developer and is available as a Perpetual license with 1 year support and maintenance. See our Stimulsoft Reports.JS licensing page for full details.
Stimulsoft Reports.JS is available individually or as part of Stimulsoft Ultimate.
聯繫電話: (888) 850 9911
傳真: +1 770 250 6199


