


官方供應商
我們作為官方授權經銷商,直接提供超過200家開發廠家所發行超過1000個的產品授權給您。
請參閱我們所有的品牌。
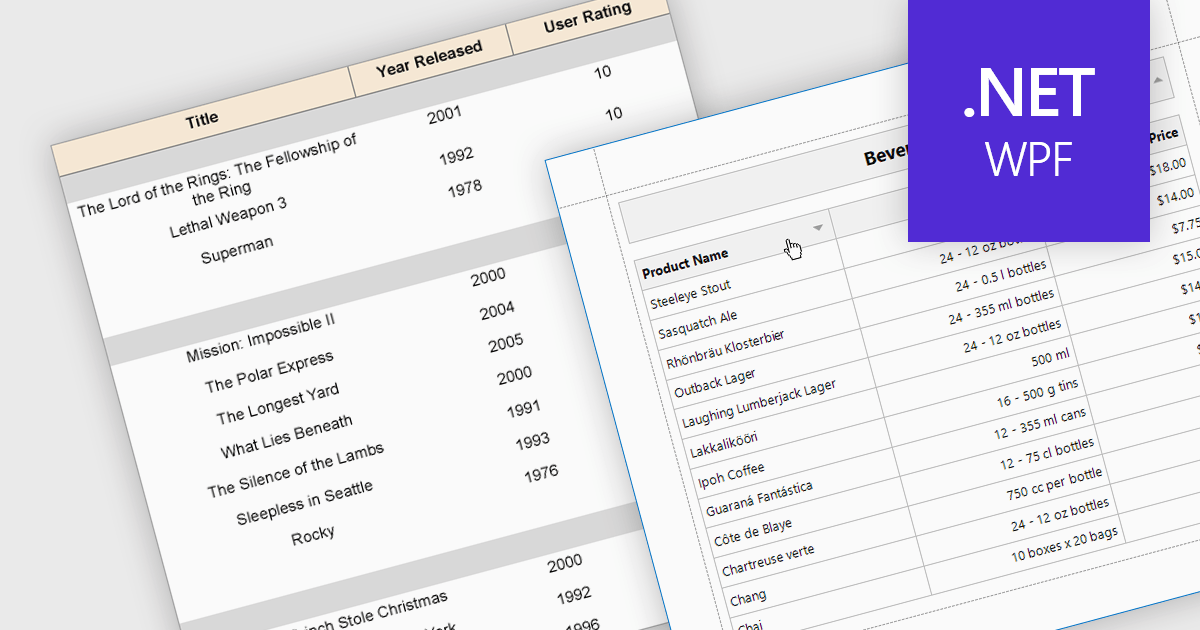
Effective reporting components benefit greatly from robust sorting functionality. This allows users to quickly organize data by any relevant column, facilitating identification of trends, outliers, and specific values. Sorting is particularly valuable for large datasets, enabling users to prioritize high-value information and tailor reports to their specific needs. This improves data exploration efficiency and user satisfaction within the reporting tool.
Several WPF reporting components support data sorting, including:
For an in-depth analysis of features and price, visit our WPF reporting components comparison.
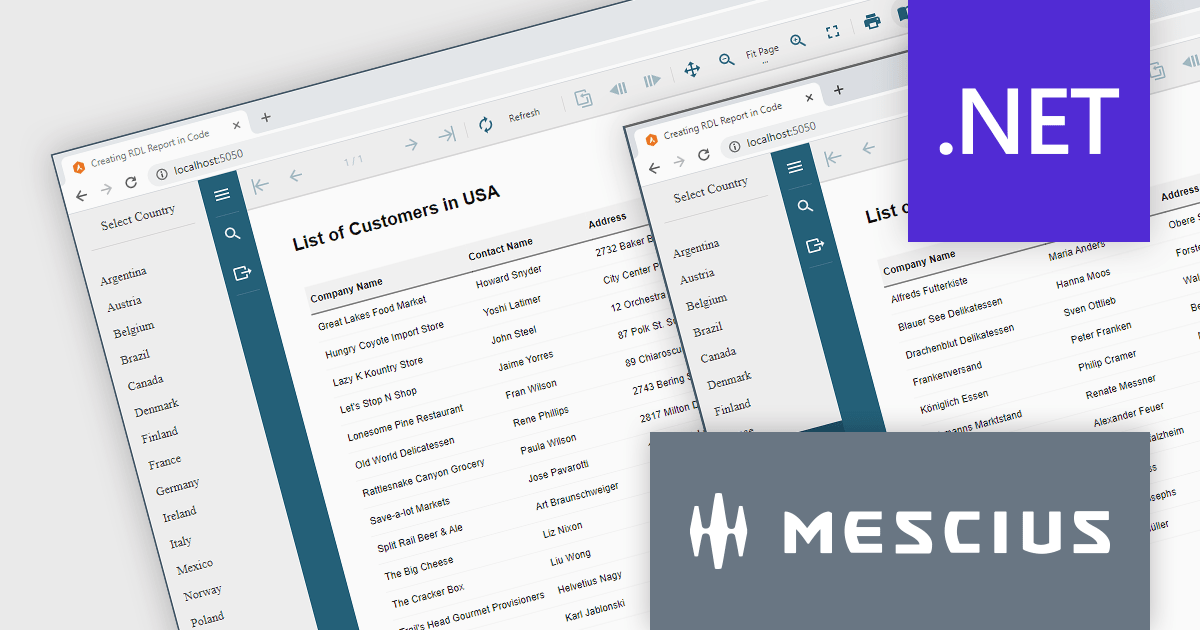
ActiveReports.NET helps you deliver beautiful reports with intuitive Visual Studio integrated report designers and rich controls. It provides code-based cross-platform reporting, easy-to-use designers, and a flexible API. Available for desktop (WinForms, WPF, .NET) and web (JavaScript, Blazor, ASP.NET MVC). Design and deliver powerful reports with intuitive, reliable, and user-friendly report designers and controls. It supports multiple report types, including RDL Reports.
Report Definition Language (RDL) defines a common schema that enables the interchange of report definitions. There are instances where it becomes necessary to programmatically generate an RDL report in your code, manage data binding conditionally at runtime, or modify the layout of a report based on user input. In this blog post, MESCIUS Product Manager Alec Gall guides you through the procedures required for using ActiveReports.NET to create an RDL report exclusively using C# code. Steps include:
Read the complete blog and learn how to leverage this powerful and flexible method for generating dynamic reports using ActiveReports.
ActiveReports.NET is licensed per developer and is available with or without a 12 month support and maintenance subscription. See our ActiveReports.NET licensing page for full details.
Learn more on our ActiveReports.NET product page.

.NET reporting controls address the challenge of integrating existing reports into new .NET applications. These controls offer conversion tools that can import reports from popular third-party vendors, allowing you to seamlessly migrate your reporting functionality without starting from scratch. This not only saves development time but also ensures continuity for users familiar with the previous report format. These controls are ideal for scenarios where legacy applications are being modernized or when integrating reports from acquired systems.
Several .NET reporting controls offer third party report conversion, including:
For an in-depth analysis of features and price, visit our comparison of .NET reporting controls.
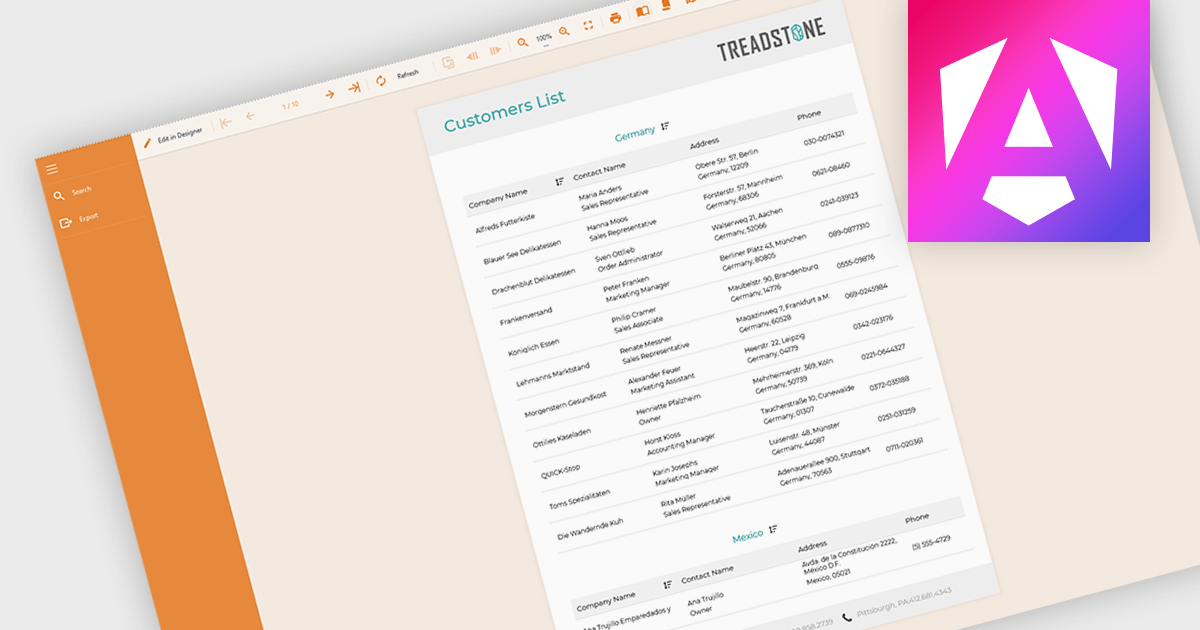
Filtering and grouping report data empowers users to drill down into specific details and identify trends. By filtering data based on relevant criteria, users can isolate subsets of information, while grouping organizes data points based on shared characteristics, allowing for comparisons and pattern recognition within the larger dataset. This combined functionality fosters a deeper understanding of the information being presented.
Several Angular reporting controls offer the ability to filter and group data including:
For an in-depth analysis of features and price, visit our Angular reporting controls comparison.
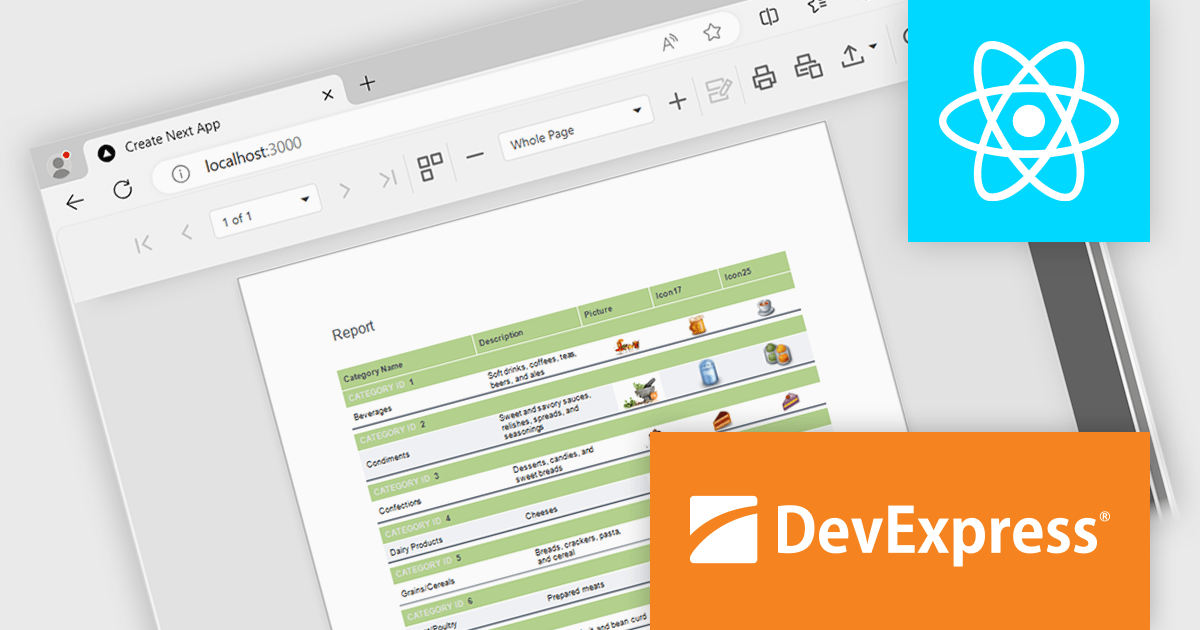
DevExpress Reporting is a powerful, versatile tool for building reports in the .NET ecosystem. It lets you design professional-looking reports with a visual editor, connect to various data sources, and customize them with charts, graphs, and interactive elements. Whether you're creating invoices, sales summaries, or complex dashboards, DevExpress Reporting offers the flexibility and features to bring your data to life in a clear and insightful way. It integrates seamlessly with WinForms, WPF, Web, and Blazor applications, making it a popular choice for developers who need a robust reporting solution.
The DevExpress Reporting 24.1 release introduces a native React Report Viewer component that streamlines the integration of reporting into React applications. This new component leverages the proven architecture of the DevExpress Angular Report Viewer, eliminating the need for JavaScript wrappers and ensuring a more responsive and performant user experience. This translates to benefits like faster rendering and a more intuitive user interface for interacting with reports within React applications, making it ideal for scenarios requiring seamless report viewing and interaction within complex React dashboards or data analysis tools.
To see a full list of what's new in version 24.1, see our release notes.
DevExpress Reporting is licensed per developer and is available as a Perpetual License with a 12 month support and maintenance subscription. See our DevExpress Reporting licensing page for full details.
DevExpress Reporting is available to buy in the following products:
聯繫電話: (888) 850 9911
傳真: +1 770 250 6199


