


官方供應商
我們作為官方授權經銷商,直接提供超過200家開發廠家所發行超過1000個的產品授權給您。
請參閱我們所有的品牌。
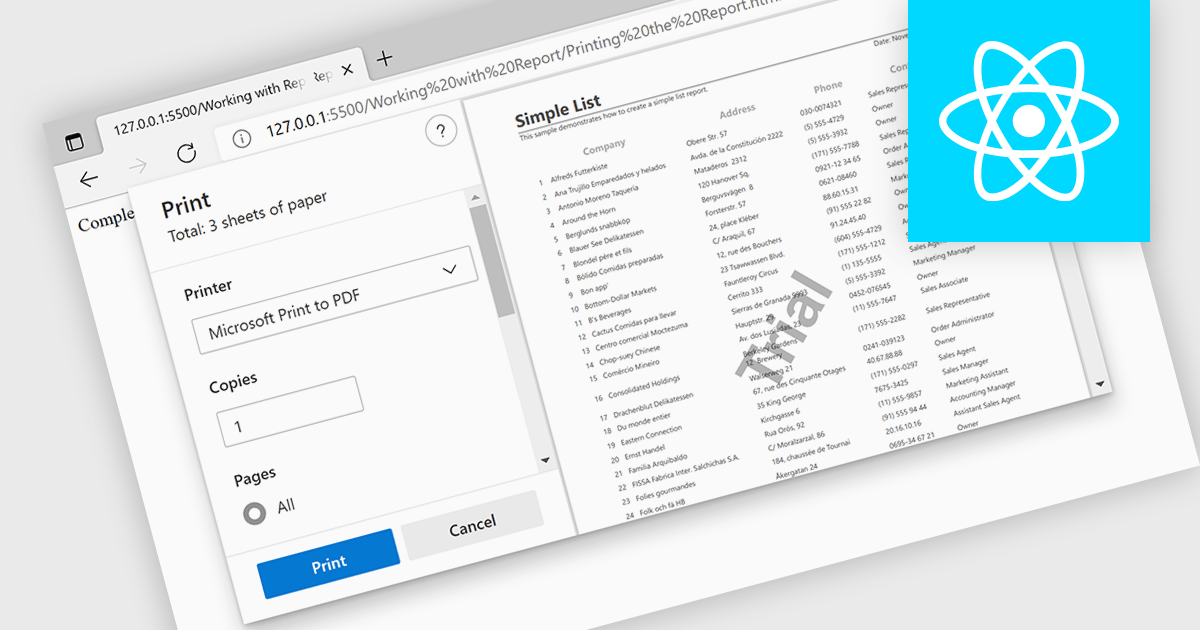
Printing functionality in reporting controls allows users to generate physical or digital copies of reports directly from within the software, ensuring seamless access to formatted, ready-to-distribute documents. This capability is especially valuable in data-driven applications where users need to share insights in a standardized format, such as in financial, operational, or compliance reporting. With printing support, users can define how reports appear on paper or in PDF format, often choosing custom layouts, page sizes, or specific sections for export, all of which aid in producing polished and accessible presentations of data. By reducing the manual steps needed to prepare data for distribution, printing functionality helps streamline workflows and enhance the utility of reporting tools for both internal and external stakeholders.
Several React reporting controls offer printing support including:
For an in-depth analysis of features and price, visit our React Reporting controls comparison.

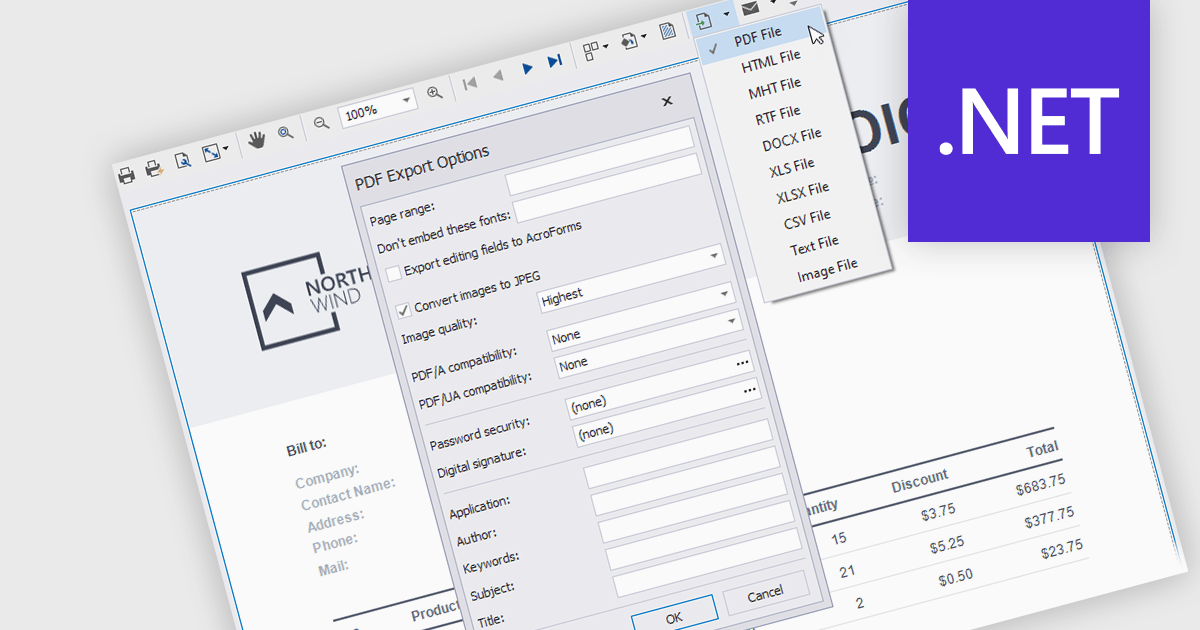
Stimulsoft Reports.NET is a reporting tool that empowers developers to design, edit, view, export, and print reports of varying complexity. It features a user-friendly report designer and an interactive viewer, allowing connection to various data sources. The generated reports can be seamlessly integrated into both Windows Forms and ASP.NET applications, with export capabilities to numerous formats for maximum flexibility.
The Stimulsoft Reports.NET 2024.4.1 release introduces a new Export Settings property, allowing export configurations to be set directly within the report template. This enhancement removes the need for separate export setup steps, ensuring consistent application of export settings each time the report is generated. By embedding export settings within the template, the report definition becomes entirely self-contained, improving portability and streamlining report management.
To see a full list of what's new in 2024.4.1, see our release notes.
Stimulsoft Reports.NET is licensed per developer and is available as a perpetual license with 1 year support and maintenance. See our Stimulsoft Reports.NET licensing page for full details.
Stimulsoft Reports.NET is available in the following products:
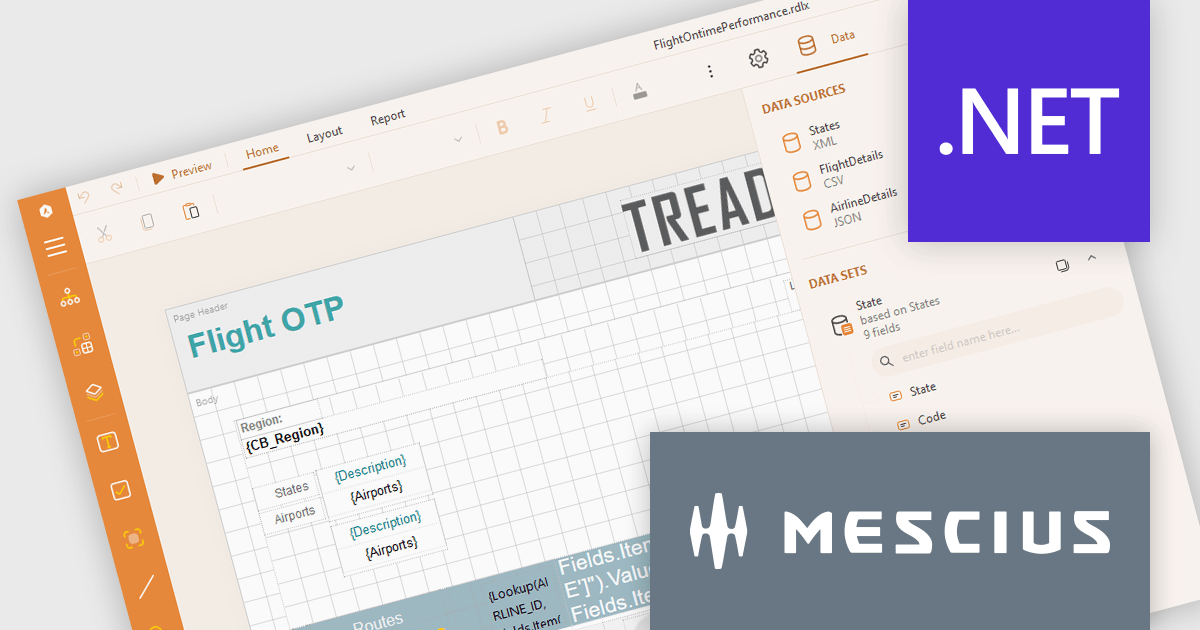
ActiveReports.NET from MESCIUS, is a comprehensive reporting solution for developers building applications in .NET. It empowers you to design and deliver visually appealing reports through user-friendly designers and a wide range of controls. ActiveReports simplifies report creation and distribution with a versatile API, rich data source connectivity, and support for multiple export formats. This translates to increased developer productivity and improved end-user experience with powerful reporting functionalities within your .NET applications.
The ActiveReports.NET v18.2 update enhances the XML Data Display in the Web Designer by introducing a tree structure for data fields, making it significantly easier to navigate and understand complex XML data. This intuitive format allows developers to quickly explore hierarchical data structures, streamlining the data binding process and reducing the effort required to interpret XML data. As a result, developers can focus more on designing reports efficiently rather than spending time deciphering the data itself, leading to a more productive and user-friendly report development experience.
To see a full list of what's new in 18.2, see our release notes.
ActiveReports.NET is licensed per developer and is available with or without a 12 month support and maintenance subscription. See our ActiveReports.NET licensing page for full details.
Learn more on our ActiveReports.NET product page.
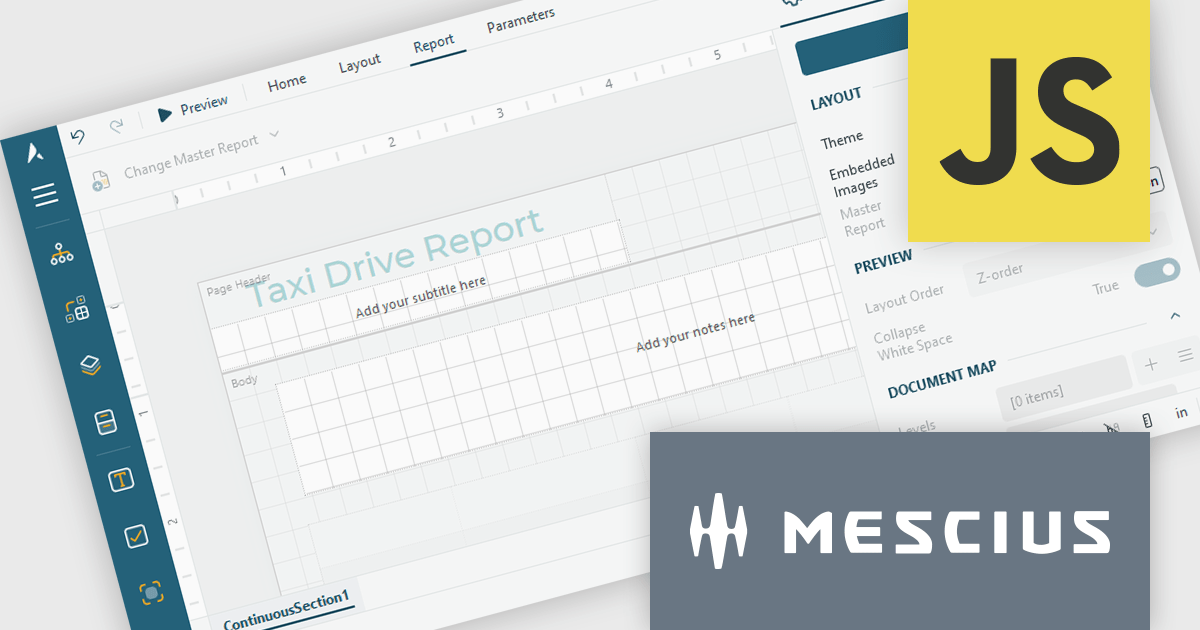
ActiveReportsJS by MESCIUS is a JavaScript reporting toolkit that empowers developers to design and embed interactive reports within web applications. It offers a standalone report designer for crafting reports and a JavaScript report viewer component for seamless integration into web frameworks like React or vanilla JavaScript. This solution streamlines report creation, facilitates data visualization, and delivers a user-friendly report experience.
The ActiveReportsJS 5.1 update introduces a Master Report feature, which improves report design efficiency by allowing developers to create reusable templates that define common elements such as headers, footers, and styles. Multiple reports can inherit shared components, reducing redundancy and simplifying maintenance. Developers can ensure consistency across reports and make global updates more efficiently, making it easier to scale for larger applications. Using a master report template is valuable in dynamic web applications, where maintaining uniform reporting structures is crucial for delivering a cohesive user experience.
To see a full list of what's new in 5.1, see our release notes.
ActiveReportsJS is licensed on an annual subscription or perpetual basis and is available as a Single Deployment License for non-commercial use, and as a Single Domain License or Unlimited Domain License for commercial and/or SaaS use. See our ActiveReportsJS licensing page for full details.
Learn more on our ActiveReportsJS product page.
Exporting and printing are critical functions in reporting components, allowing users to share, archive, and distribute report data in various formats. These capabilities extend the utility of reports beyond digital screens, enabling the conversion of structured data into tangible, shareable files for offline access or formal documentation. Whether exporting reports to widely used formats like PDF or printing hard copies, these features enhance accessibility and flexibility in presenting business insights and data analysis.
Common features include:
For an in-depth analysis of features and price, visit our .NET reporting components comparison.
聯繫電話: (888) 850 9911
傳真: +1 770 250 6199


