Reporting 新聞

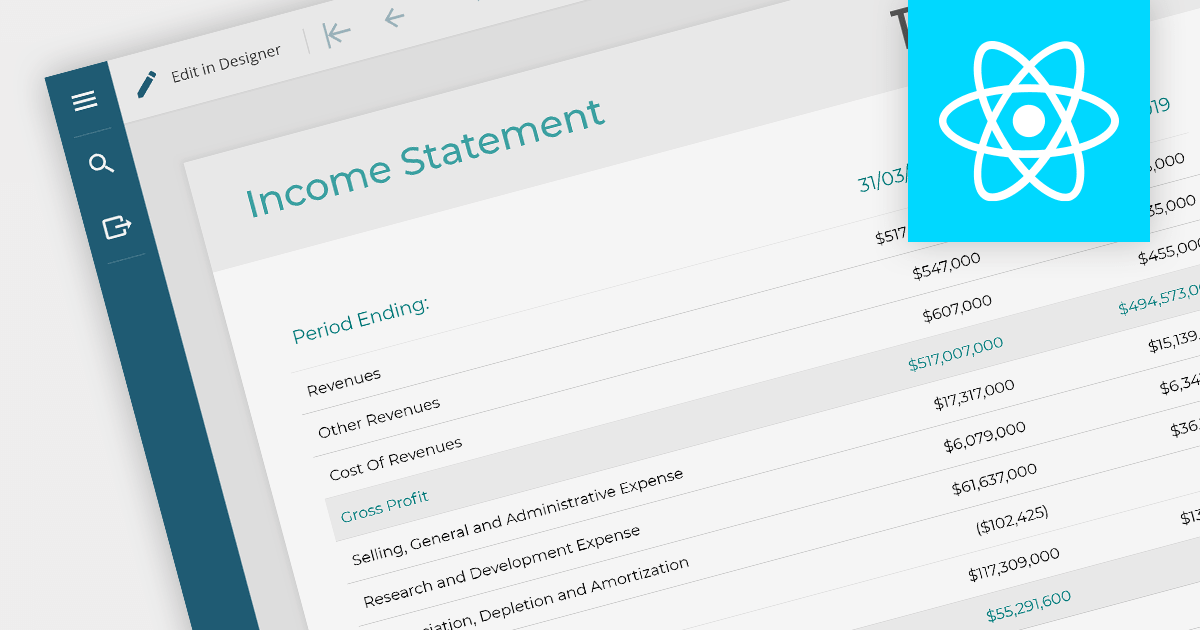
在 React 中查看報表

7月 25, 2023
使用 React 檢視器在 Web 上顯示、分析和交互報表。

Report viewers for React let users view and interact with various types of reports on the Web. They make it easy to embed reports, display a variety of report types, and customize the look and feel of reports, as well as enabling interactions such as zooming, panning, and filtering. Report viewers let users explore and gain valuable insights from their data directly within the React environment.

Here is a selection of React reporting controls include report viewers:

  • Stimulsoft Reports.JS gives users dynamic report viewing capabilities. Its robust set of features includes charts, pivot tables, and customizable templates, ensuring a seamless user experience for analyzing data within the React environment.
  • ActiveReports.JS by GrapeCity allows you to easily incorporate React report viewers to visualize data in various formats. It offers interactive data visualization tools and export options, enabling users to comprehend complex information more easily.
  • DevExpress Reporting can be used to create interactive and data-rich reports integrated with your React Web applications. The report viewer lets users interact with data through filtering, sorting, and drilling down, ensuring a comprehensive understanding of critical insights.

For an in-depth analysis of features and price, visit our comparison of React reporting controls.
Compare React Reporting Controls

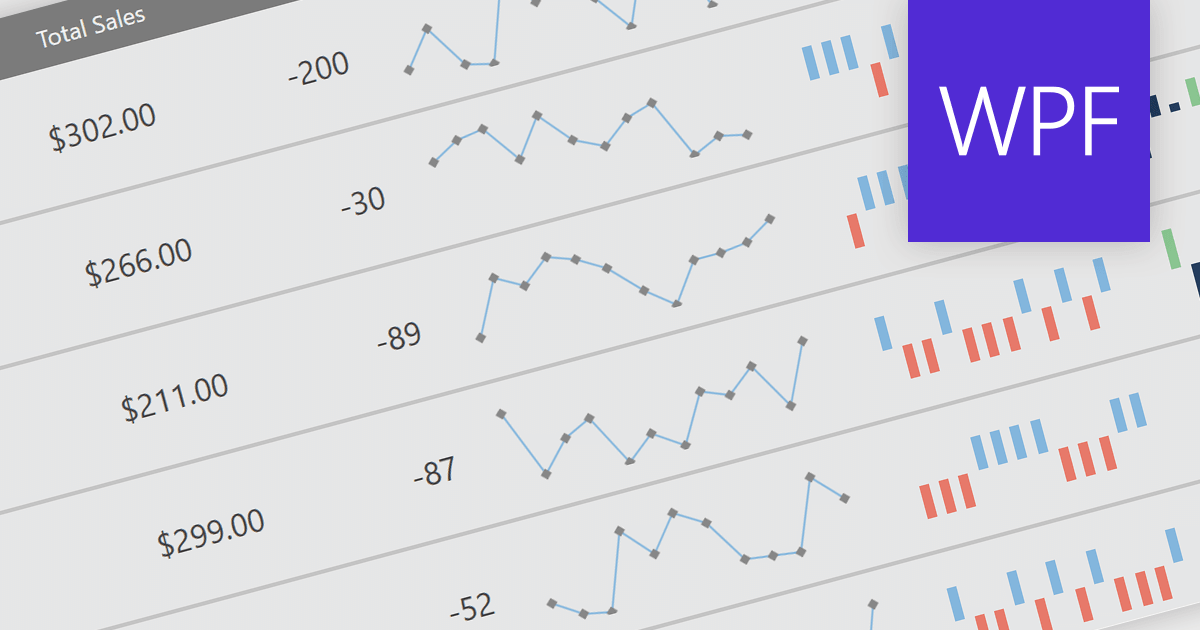
用 WPF 將迷你圖添加至您的報表

6月 19, 2023
透过在您的 WPF 報表的儲存格內添加微型圖表來突出顯示資料趨勢。

Sparklines are miniature line graphs designed to provide a visual representation of data trends within a compact space. They condense information into a single line or bar, often displayed alongside text or numbers. They allow for quick and intuitive understanding of patterns, making them useful for displaying data in tight spaces such as data tables, and providing visual summaries at a glance.

The following WPF reporting controls include support for sparklines:

  • DevExpress Reports (Multi-Platform) (part of DevExpress Reporting) is a versatile solution with sparkline support that allows developers to build visually appealing reports in WPF applications.
  • ActiveReports.NET by MESCIUS (formerly GrapeCity) offers a range of flexible and customizable controls, allowing developers to integrate sparklines seamlessly into their reports and deliver engaging data visualizations.
  • List & Label Enterprise Reporting Edition by combit provides a wide selection of reporting features including sparklines, empowering developers to create interactive and visually informative reports with ease.
  • Stimulsoft Reports.Wpf has an intuitive design environment which helps developers design reports with sparklines to effectively convey insights to end users.

For an in-depth analysis of features and price, visit our comparison of WPF reporting controls.

Compare WPF Report Controls