













官方供應商
我們作為官方授權經銷商,直接提供超過200家開發廠家所發行超過1000個的產品授權給您。
請參閱我們所有的品牌。
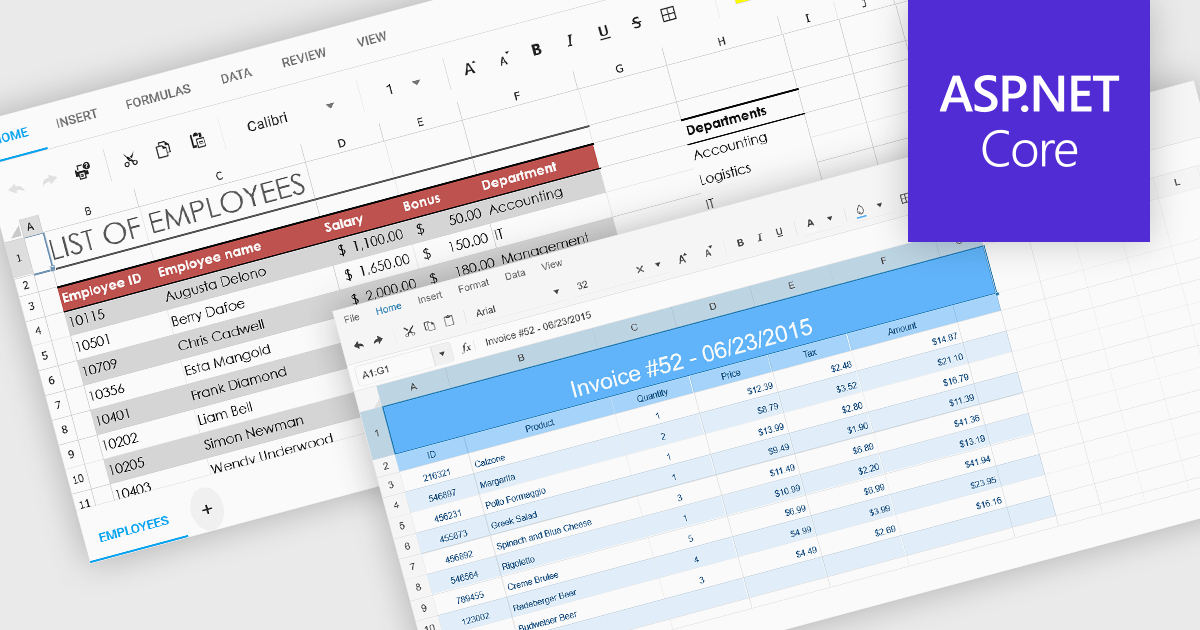
Cell formatting in spreadsheet components allows developers to manipulate the visual presentation of spreadsheet data, enhancing clarity and usability. This includes adjusting font styles, colors, borders, number formats, and alignment, which is especially valuable for building business or financial applications where precise data representation is critical. Such formatting capabilities ensure that end-users can interact with spreadsheets that are both functional and aesthetically tailored to the specific context of the application.
Several ASP.NET Core spreadsheet components support cell formatting, including:
For an in-depth analysis of features and price, visit our ASP.NET Core spreadsheet controls comparison.
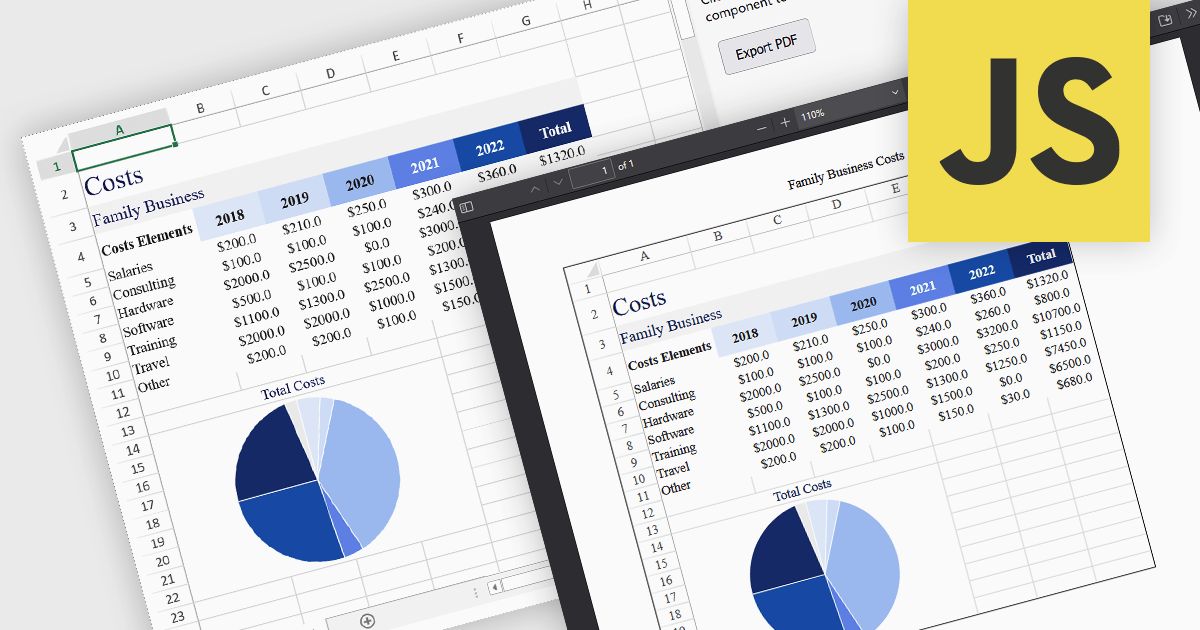
Exporting a spreadsheet to PDF from a JavaScript application is a widely used feature that allows users to generate portable, print-ready documents directly from the browser. It converts the contents of a spreadsheet, such as cell data, formulas, formatting, charts, and images into a Portable Document Format (PDF) file. This capability ensures that the data, formatting, and layout from the original spreadsheet are preserved without relying on external applications or manual intervention. It is particularly useful for generating reports, invoices, or records that need to be shared, printed, or archived in a fixed format. By enabling PDF generation directly within the web application, developers can offer users a straightforward method to archive, print, or share spreadsheet content in a consistent and professional format across devices and platforms.
Several JavaScript spreadsheet components allow you to export to PDF, including:
For an in-depth analysis of features and price, visit our comparison of JavaScript spreadsheet components.
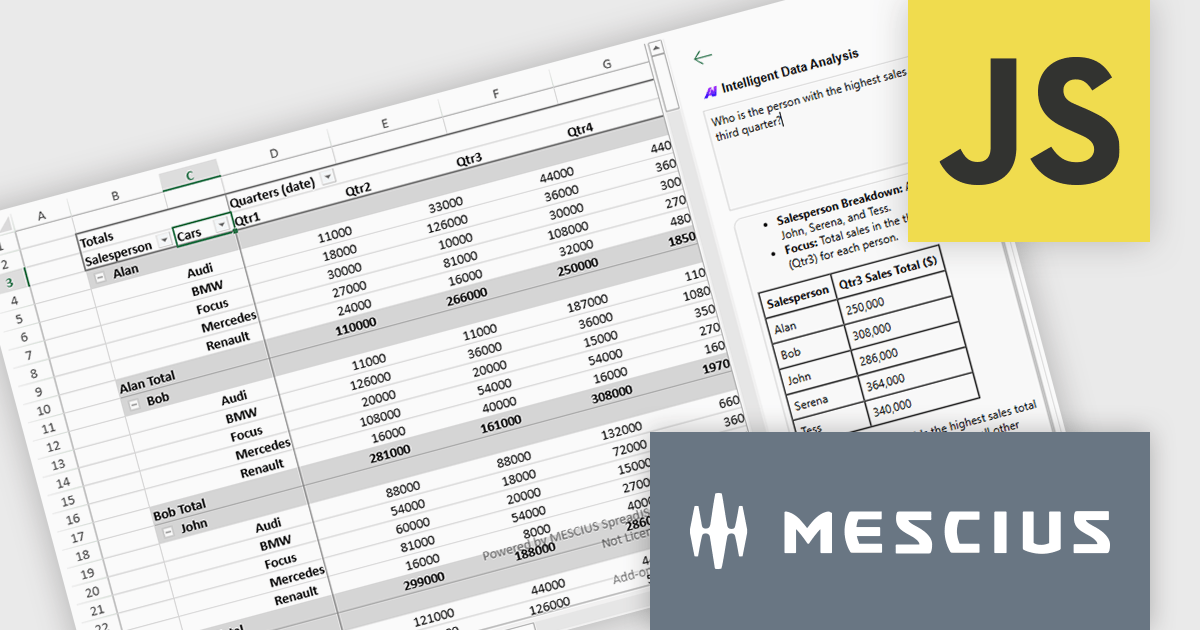
SpreadJS by MESCIUS is a high-performance JavaScript spreadsheet component designed to integrate Excel-like functionality into web applications. It allows developers to deliver robust spreadsheet experiences within their applications, complete with features like data import/export, complex formulas, conditional formatting, and extensive customization options. SpreadJS caters to a wide range of use cases, from financial modeling and data analysis to project management and interactive dashboards, ultimately allowing developers to build feature-rich and user-friendly web applications. SpreadJS 18.1 includes a Developer Preview of powerful AI-driven features designed to transform how users interact with JavaScript spreadsheets.
In this blog post, SpreadJS Product Manager Chris Bannon takes you through each of these AI features, shows you how to use them, and highlights the value they can bring to your JavaScript applications. The SpreadJS AI Add-on preview includes the following capabilities:
Read the full blog to get started exploring the benefits available in adding AI into your JavaScript spreadsheets.
SpreadJS is licensed per developer and includes 1 Year Maintenance (major and minor version releases and unlimited support phone calls). SpreadJS requires an Annual or Perpetual Deployment License. The optional Add-ons are available at an additional cost, and require a SpreadJS license. See our SpreadJS licensing page for full details.
For more information, visit our SpreadJS product page.
Xceed Workbooks for .NET is a software component designed for .NET developers that enables the creation and manipulation of Microsoft Excel .xlsx files directly within their applications, without requiring Microsoft Excel or Office to be installed; it provides an API that allows for programmatic control over spreadsheet content, formatting, and structure, facilitating tasks such as report generation, data analysis, and document automation.
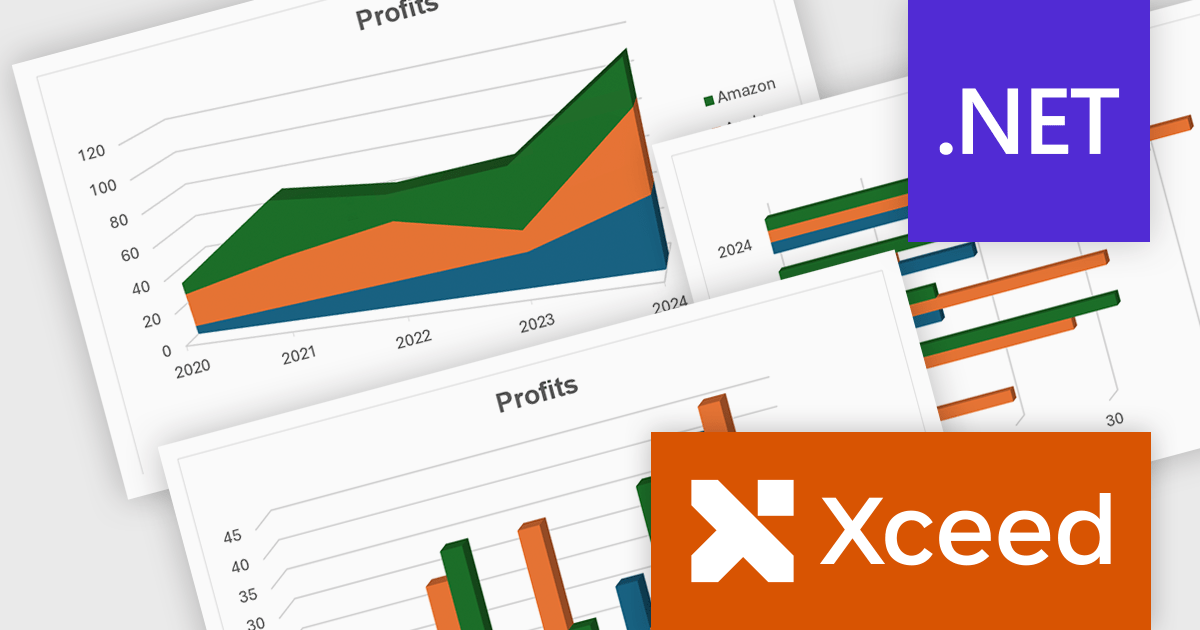
The Xceed Workbooks for .NET V3.0 release significantly enhances charting capabilities by allowing developers to programmatically create and manage a wide range of chart types without relying on external tools. From standard line, column, bar, pie, and doughnut charts to more advanced options like scatter, bubble, radar, and stock charts, the update ensures broad coverage of data visualization needs. Notably, the version also brings in new 3D chart types such as Surface3D and Contour3D, offering more depth and interactivity for technical and scientific data presentation. This expanded support empowers users to deliver polished, professional-grade reports and dashboards within their .NET environments.
To see a full list of what's new in V3.0, see our release notes.
Xceed Workbooks for .NET is licensed per developer and is available as a perpetual license with 1 year of updates and support. See our Xceed Workbooks for .NET licensing page for full details.
Xceed Workbooks for .NET is available individually or as part of Xceed Ultimate Suite.
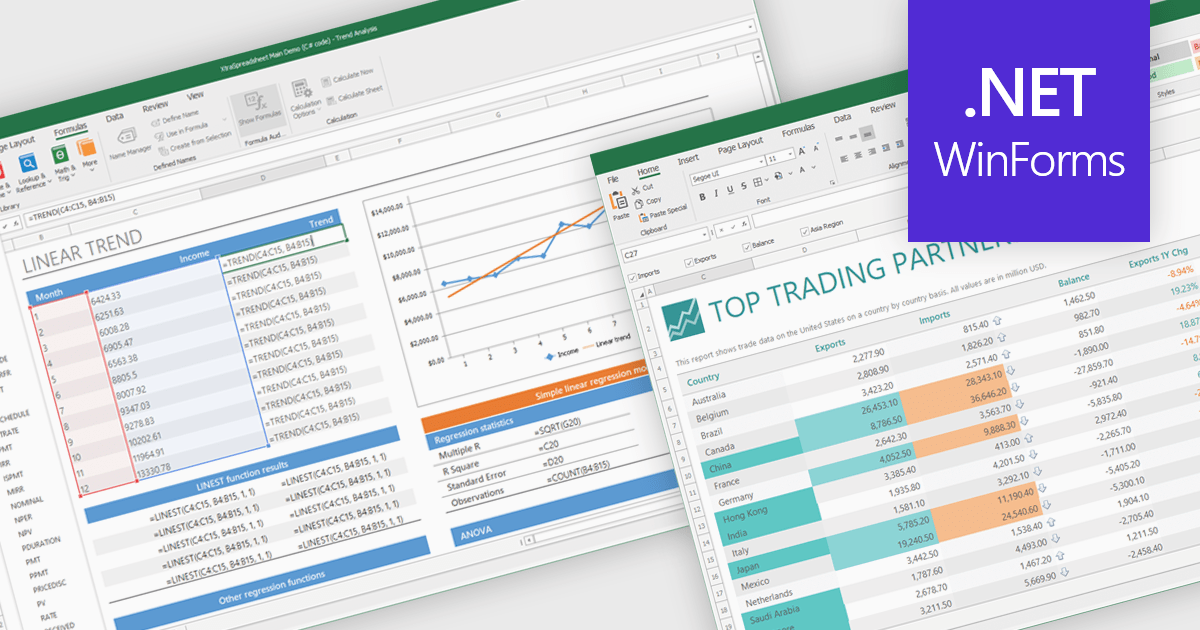
Chart support in a spreadsheet component refers to the ability to create, render, and manipulate various types of charts - such as line, bar, pie, and area charts - all within the spreadsheet environment. This functionality allows spreadsheet developers to present data visually and dynamically, without needing to rely on external charting libraries. The integration of charting capabilities enhances the end-user experience by making complex data more understandable. For developers, this reduces the need for separate visualization components, improves performance through tighter integration, and simplifies the deployment of data-centric applications.
Several .NET Winforms spreadsheet controls offer chart support, including:
For an in-depth analysis of features and price, visit our .NET Winforms spreadsheet controls comparison.
聯繫電話: (888) 850 9911
傳真: +1 770 250 6199


