


官方供應商
我們作為官方授權經銷商,直接提供超過200家開發廠家所發行超過1000個的產品授權給您。
請參閱我們所有的品牌。
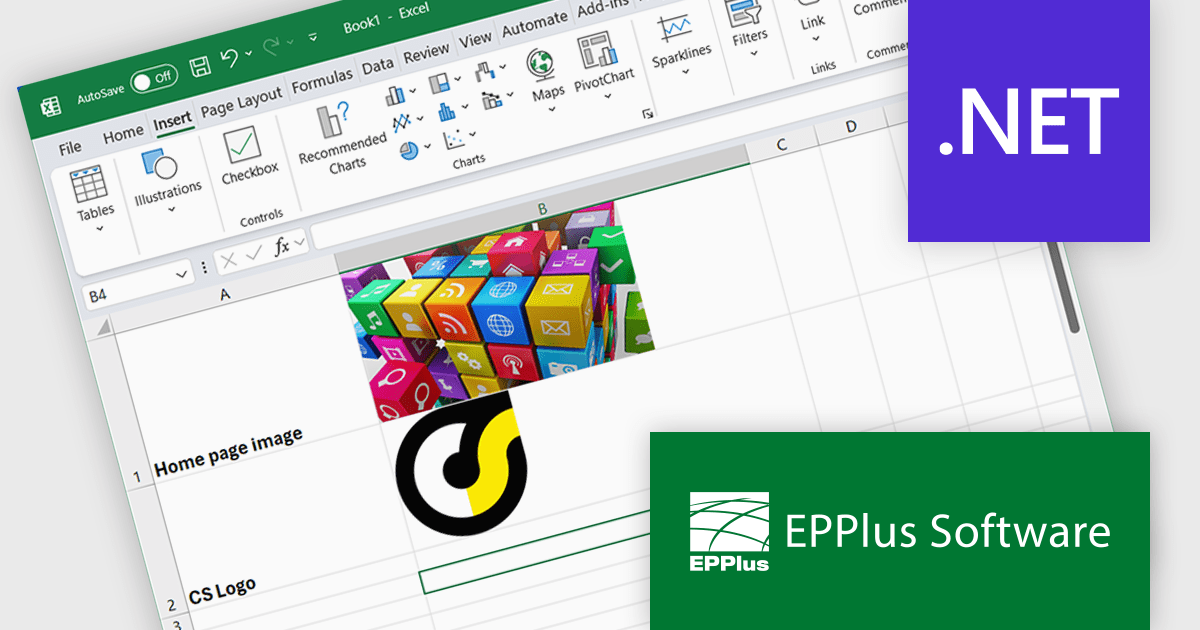
EPPlus is a powerful and versatile .NET library for managing and manipulating Microsoft Excel files using the Office Open XML (OOXML) format. It is a lightweight and efficient library that is easy to use and can be integrated into a wide range of applications. It allows developers to create, read and modify spreadsheets without dependencies on any other library. Features include pivot tables, styling, VBA/Form controls, conditional formatting, charts, tables, formula calculation, data validation, pictures/shapes, and more.
The EPPlus v8.0.1 update enhances the visualization of spreadsheet data by introducing the ability to insert images directly into individual worksheet cells. This feature is particularly beneficial for creating more informative and engaging spreadsheets, such as including product images in inventory lists or embedding charts alongside relevant data. The new functionality supports various image formats, such as PNG, JPG and GIF, and integrates with the IMAGE function, so you can add local images as well as download images from the web via URLs.
To see a full list of what's new in v8.0.1, see our release notes.
EPPlus is licensed per developer and is available as both perpetual licenses and subscription based licenses with periods of 1 year and 2 years, which include support and upgrades. See our EPPlus licensing page for full details.
For more information, see our EPPlus product page.
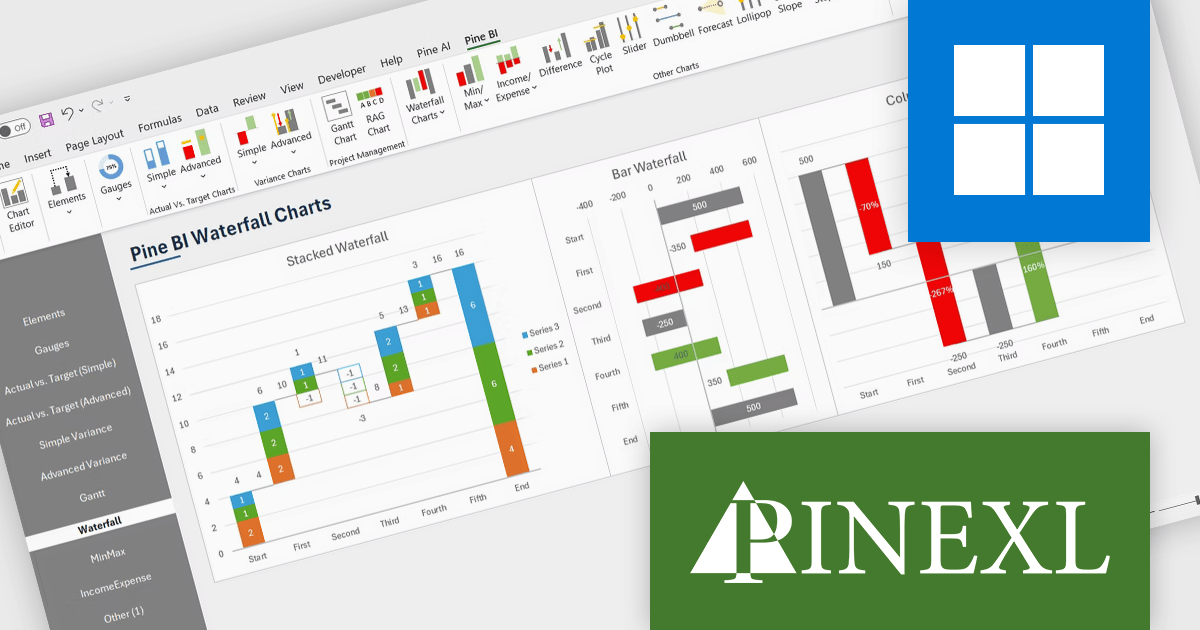
The Pine BI Excel Add-In facilitates the rapid generation of sophisticated and interactive Excel charts, enabling the transformation of standard workbooks into engaging dashboards that improve data visualization. These easily shareable visuals can also be seamlessly integrated into Microsoft Word and PowerPoint, streamlining data analysis workflows and enhancing the creation of impactful reports and presentations across various business applications.
The Pine BI Excel Add-In v2.0 update adds functionality to generate stacked waterfall charts directly within the Excel environment, providing developers with a programmatic and user-friendly method to visualize sequential data contributions to a final value. This embedded feature eliminates the need for external charting libraries or manual data manipulation, streamlining the process of creating insightful visualizations for financial analysis, performance monitoring, and comparative reporting within their Excel-based applications and solutions. Developers can leverage this capability to enhance data presentation and user understanding without requiring specialized charting expertise or reliance on separate tools.
To see a full list of what's new in v2.0, see our release notes.
Pine BI Excel Add-In is licensed annually on a subscription basis with 1, 5, and 10 seat options, requiring renewal for continued use and covering each concurrent computer, with the ability to transfer individual seat activation's as needed. See our Pine BI Excel Add-In licensing page for full details.
For more information, explore the Pine BI Excel Add-In product range.
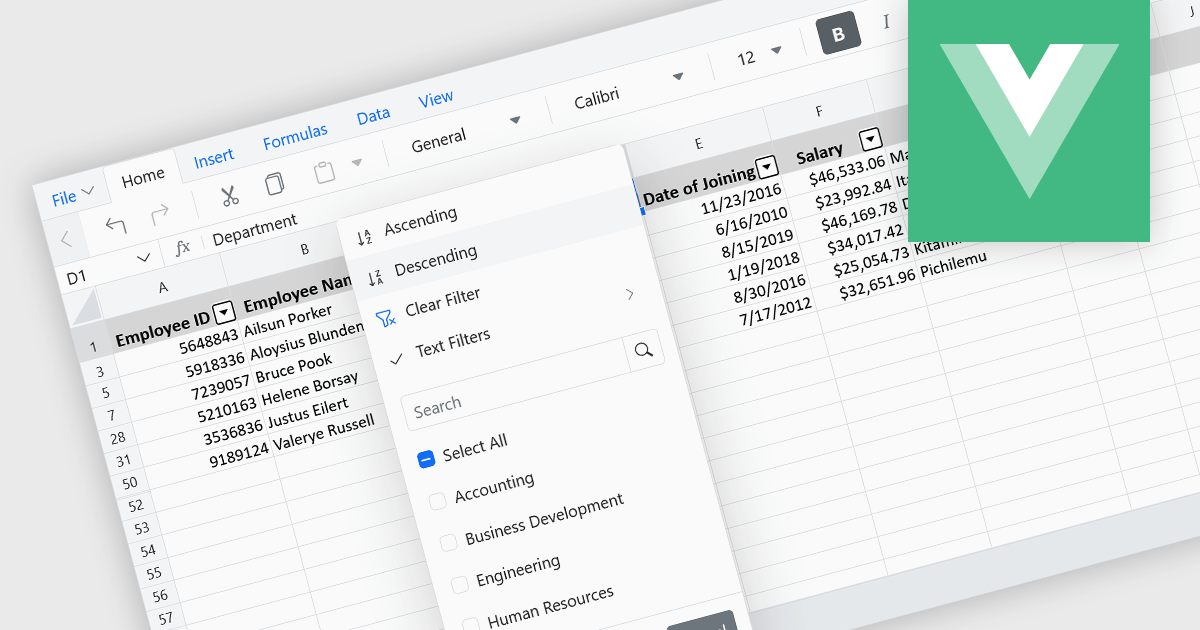
Data sorting in a spreadsheet control is a fundamental feature that enables users to rearrange data within a grid or table based on specific criteria, typically ascending or descending alphabetically or by numerical value. Sorting will usually be performed on single or multiple columns and is often integrated with other data manipulation tools like filtering, grouping, and searching. By sorting data, users can quickly locate and analyze information, identify patterns, and ensure consistency across records. Especially useful in large datasets, it improves the readability of the information and makes it more organized in preparation for decision-making, reporting, and data validation. This capability facilitates efficient data analysis, and supports better user interaction by allowing datasets to be viewed in meaningful sequences.
Several Vue.js spreadsheet controls allow you to sort data, including:
For an in-depth analysis of features and price, visit our comparison of Vue.js spreadsheet controls.
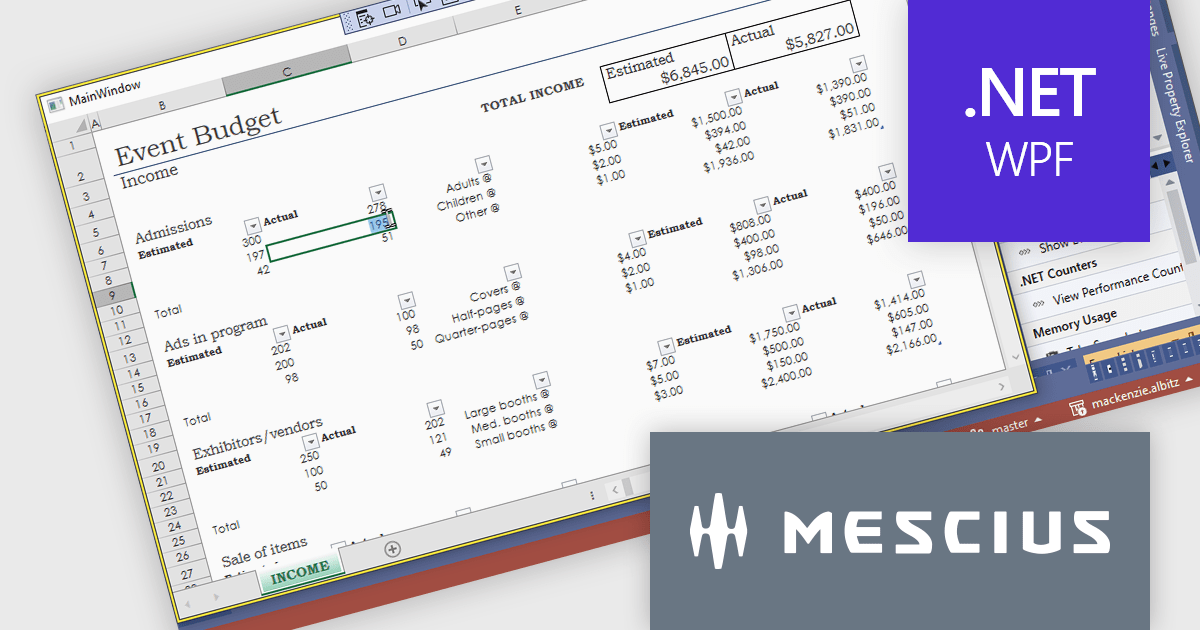
Spread.NET helps you create spreadsheets, grids, dashboards, and forms. It includes a powerful calculation engine with 450+ functions and the ability to import and export Excel spreadsheets. Leverage the extensive .NET spreadsheet API and powerful calculation engine to create analysis, budgeting, dashboard, data collection and management, scientific, and financial applications.
In this blog post, MESCIUS Product Marketing Specialist Mackenzie Albitz demonstrates how to use Spread.NET to enable your WPF application to display or interact with Excel files using a dedicated viewer. She'll walk through how to add an Excel XLSX viewer to a WPF app using the WPF spreadsheet control, Spread.NET for WPF. You'll learn how to load a .xlsx file, lock down the worksheet, and allow users to edit only specific cells — perfect for budget forms, reports, or review-only sheets. Once you have created a WPF project, the steps are as follows:
Detailed sample code is included and you can even download a sample project to follow along.
Read the full blog post to learn how to add this versatile capability to your WPF applications.
Spread.NET is licensed per developer and is available as a Perpetual License with a 12 month support and maintenance subscription. We can supply any Spread.NET license including new licenses, maintenance renewals, and upgrade licenses. See our Spread.NET licensing page for full details.
For more information, visit our Spread.NET product page.
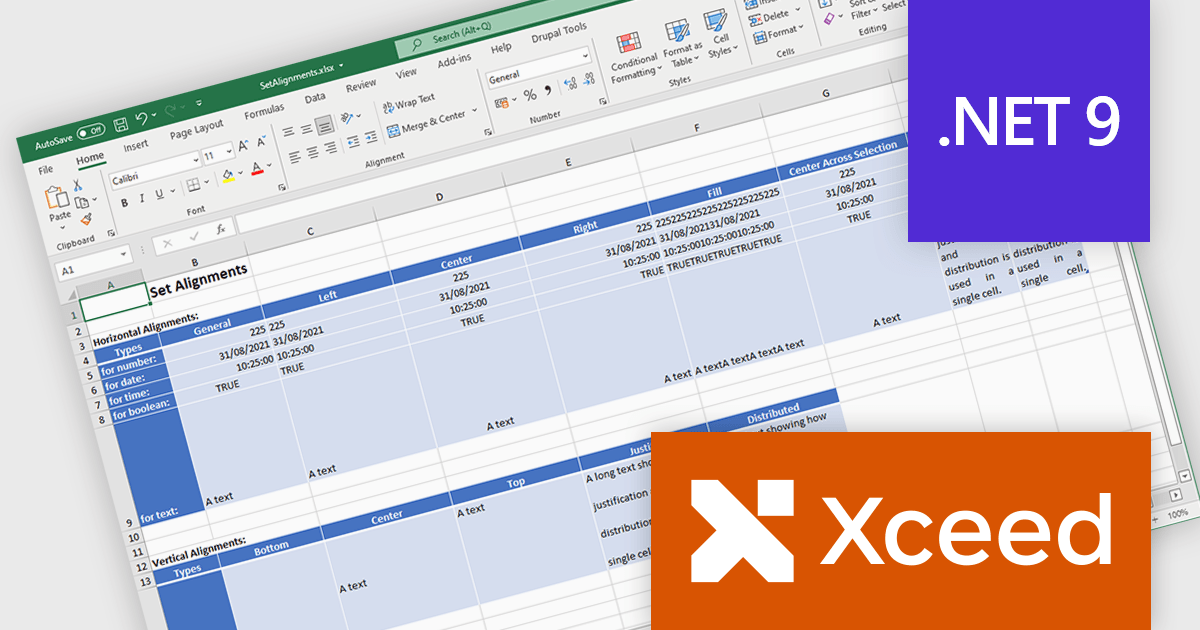
Xceed Workbooks for .NET is a software component designed for .NET developers that enables the creation and manipulation of Microsoft Excel .xlsx files directly within their applications, without requiring Microsoft Excel or Office to be installed; it provides an API that allows for programmatic control over spreadsheet content, formatting, and structure, facilitating tasks such as report generation, data analysis, and document automation.
The Xceed Workbooks for .NET 2.0 release adds support for .NET 9. This primarily ensures compatibility with the latest .NET ecosystem, allowing developers to leverage new features, performance improvements, and security enhancements within their applications. This compatibility future-proofs projects, minimizes integration issues, and maintains alignment with the evolving .NET platform, enabling developers to build more efficient and maintainable software using Xceed Workbooks.
To see a full list of what's new in version 2.0, see our release notes.
Xceed Workbooks for .NET is licensed per developer and is available as a perpetual license with 1 year of updates and support. See our Xceed Workbooks for .NET licensing page for full details.
Xceed Workbooks for .NET is available individually or as part of Xceed Ultimate Suite.
聯繫電話: (888) 850 9911
傳真: +1 770 250 6199


