


官方供應商
我們作為官方授權經銷商,直接提供超過200家開發廠家所發行超過1000個的產品授權給您。
請參閱我們所有的品牌。
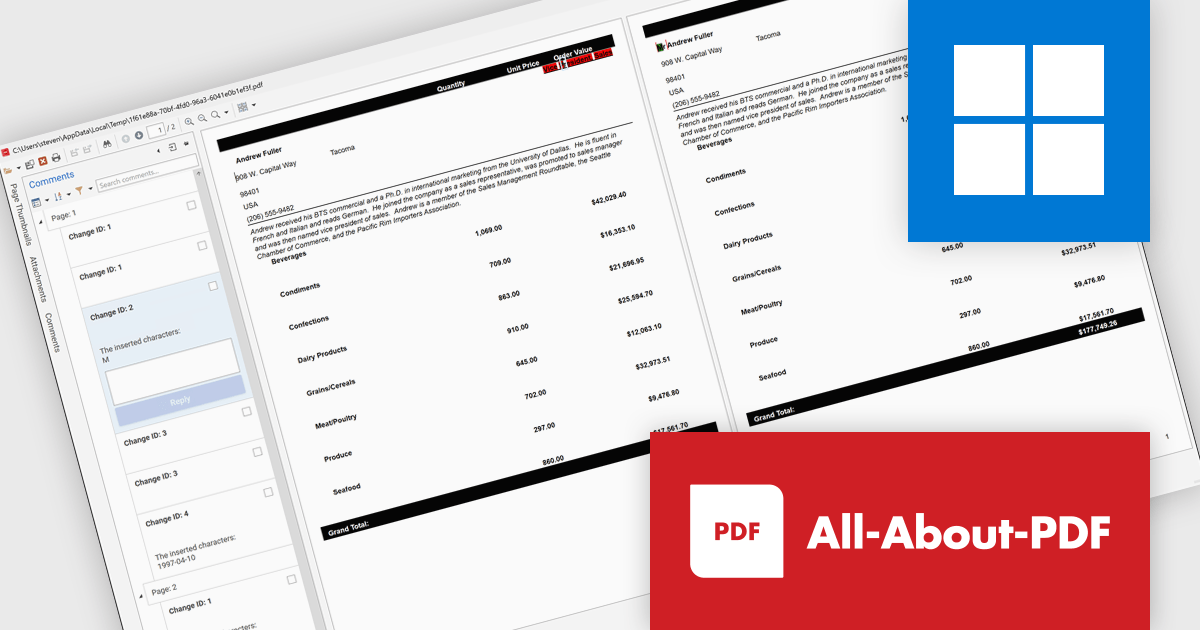
All-About-PDF is a comprehensive PDF management solution that gives users complete control over their digital documents. It allows individuals and organizations to create, protect, convert, merge, split, and compare PDFs with ease while maintaining the highest level of security. Using advanced Digital Rights Management technology, users can specify when, how, and where their shared files are accessed. Features such as password protection, expiry dates, print restrictions, and location-based locking help safeguard sensitive information. With its precision comparison tools and strong access controls, All-About-PDF is ideal for professionals who need to share documents confidently and maintain full ownership of their intellectual property.
The All-About-PDF Build 2035 update introduces a precise PDF comparison feature that enables developers to quickly identify differences between document versions with high accuracy. This enhancement improves version control and quality assurance by automatically detecting and highlighting text, formatting, and structural changes. It eliminates the need for manual reviews, reduces the risk of overlooking small edits, and helps maintain consistency across project documentation, reports, and deliverables. For development teams handling frequent revisions or compliance-sensitive content, this feature provides an efficient way to validate updates and ensure the integrity of shared files throughout the development lifecycle.
To see a full list of what's new in Build number 2035 , see our release notes.
All-About-PDF is licensed per machine, and is available as a perpetual license. We can supply Internal, External and OEM licenses. See our All-About-PDF licensing page for full details.
For more information, visit our All-About-PDF product page.
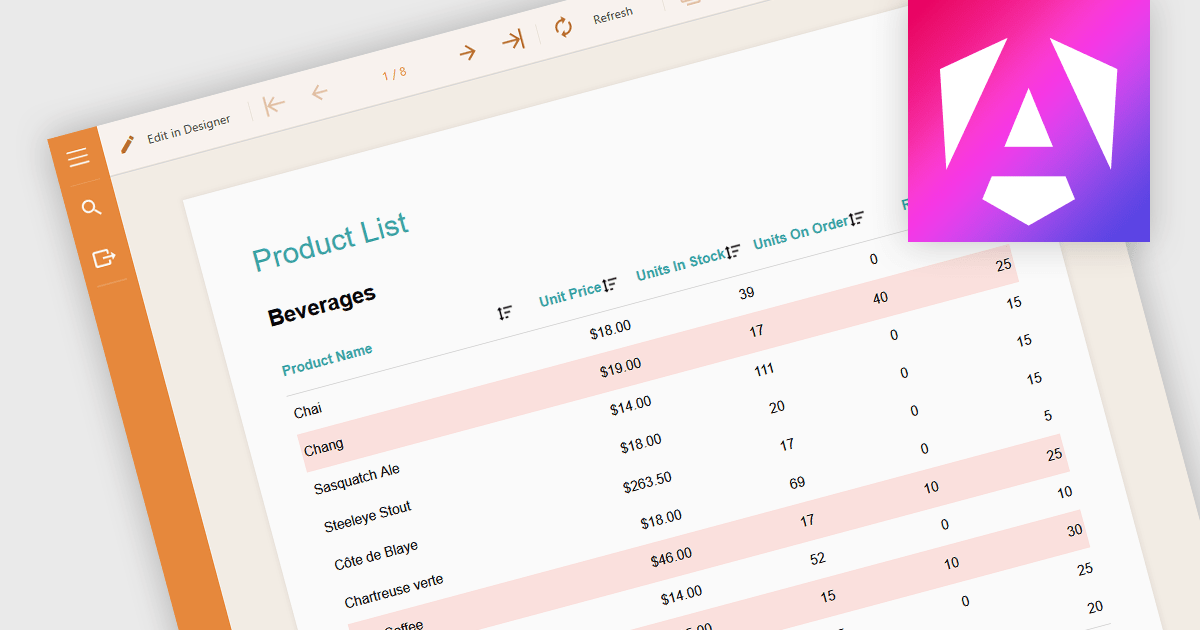
Conditional formatting in a report is a feature that automatically applies visual styles, such as font or background color, to the content within the report based on logical conditions or the data values themselves. This technique allows users to highlight trends, anomalies, or key thresholds by dynamically adjusting the appearance of report elements according to predefined rules, which is especially useful in performance monitoring or exception tracking scenarios. It improves the readability of data-heavy reports by making important information stand out, helping users quickly identify patterns, exceptions, or performance issues. For developers and analysts, it provides a practical way to make complex datasets easier to interpret without manual intervention.
Several Angular reporting components allow you to apply conditional formatting, including:
For an in-depth analysis of features and price, visit our comparison of Angular reporting components.
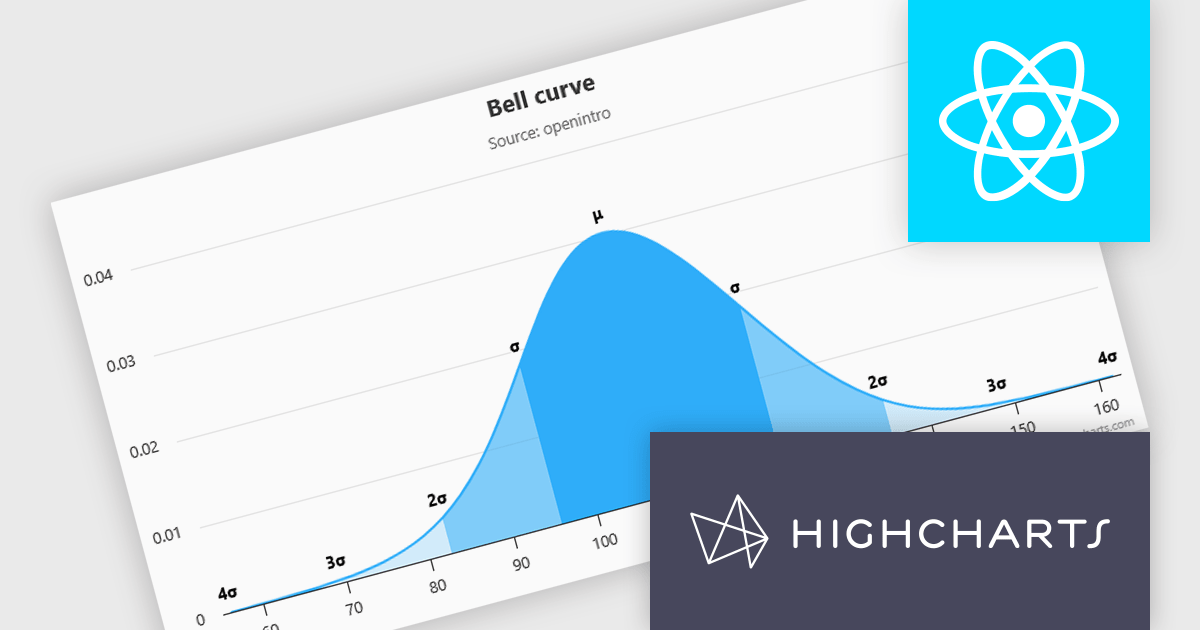
Highcharts is a JavaScript charting framework that allows web developers and data analysts to generate dynamic, visually appealing charts and graphs for websites and web applications. It can display a variety of chart types, including line, spline, area, column, bar, pie, scatter, and many more. Highcharts is well-known for its ease of use, rich documentation, and ability to handle huge datasets efficiently. Features include responsive design, accessibility support, and cross-browser compatibility. Its customization capabilities allow users to create bespoke data visualizations that increase engagement and provide insightful data presentations.
Highcharts has introduced a major update for React developers, focusing on a smoother and more natural experience when working with charts in React applications. The newly refined API now mirrors common React patterns, allowing developers to write less boilerplate and avoid workarounds. Integration is more seamless too - custom React components can be passed directly into chart configurations, enabling dynamic, reusable elements like tooltips and data-fetching containers without resorting to hacks. The update also brings full support for ECMAScript Modules (ESM), aligning with modern JavaScript standards and enabling better build optimization. With this release, Highcharts continues to provide a comprehensive set of chart types, from basic line graphs to advanced stock visualizations, all within a React-friendly environment.
Highcharts Core is licensed on an annual or perpetual basis, OEM licenses, and Advantage Renewals. It is licensed per Developer and has several license options including Internal, SaaS, SaaS+, and Self Hosted. See our Highcharts Core licensing page for full details.
Learn more on our Highcharts Core product page.
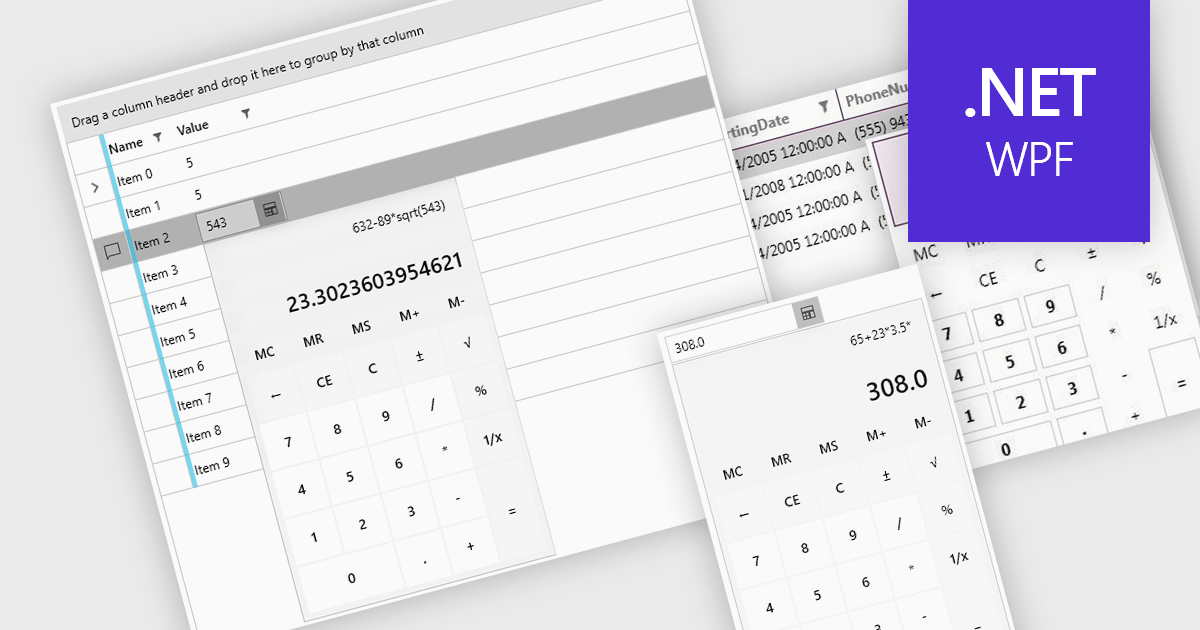
Dropdown calculators are interactive user interface components that integrate a compact calculator directly into a standard dropdown control, allowing users to perform quick calculations or adjust numerical values without navigating away from the current input field. This interaction pattern is particularly useful in data-heavy applications where users frequently need to input or modify numerical data, such as e-commerce pricing, financial tools, form-based systems, or configuration panels. By integrating calculation capabilities directly into the dropdown, these components reduce the need for external tools, help maintain focus, and improve the overall speed and accuracy of user input.
Several WPF data editor collections offer a dropdown calculator, including:
For an in-depth analysis of features and price, visit our comparison of WPF data editors collections.
FastReport .NET Ultimate is a comprehensive reporting solution for developers working within the Microsoft .NET ecosystem. It supports the creation, design, and delivery of rich, interactive reports across Windows Forms, ASP.NET, MVC, and .NET Core applications. The Ultimate edition includes server deployment capabilities and extensive export options, such as PDF, Excel, Word, and HTML. It connects to various data sources, including SQL databases and business objects, providing flexibility for enterprise-level reporting. With the integrated FastReport Online Designer, users can edit reports directly in their browsers, enabling efficient collaboration and modern, full-featured report design across both desktop and web platforms.
The FastReport .NET Ultimate 2026.1 update introduces an improved Ribbon interface and a new 'RibbonDesignerControl', giving developers a more intuitive and efficient report design experience. The redesigned Ribbon UI offers a cleaner, more structured layout that simplifies access to tools and settings, improving usability and reducing development time. This addition allows developers to integrate the same modern Ribbon interface directly into their own applications, providing a consistent and familiar design environment for end users. This enhancement supports smoother workflows, greater customization, and a more professional user experience across both desktop and web reporting solutions.
To see a full list of what's new in version 2026.1, see our release notes.
FastReport .NET Ultimate is licensed per named user and is available as a perpetual license with a one-year subscription for updates and support. See our FastReport .NET Ultimate licensing page for full details.
For more information, visit our FastReport .NET Ultimate product page.
聯繫電話: (888) 850 9911
傳真: +1 770 250 6199


