


官方供應商
我們作為官方授權經銷商,直接提供超過200家開發廠家所發行超過1000個的產品授權給您。
請參閱我們所有的品牌。
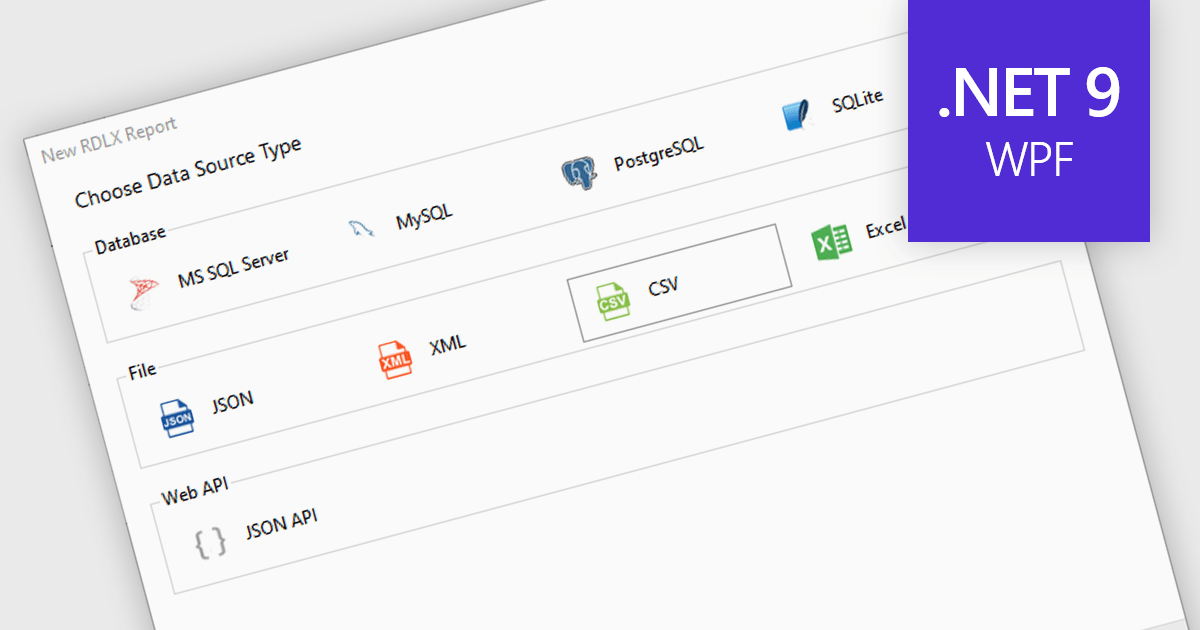
Excel / CSV data connectivity in a .NET 9 WPF reporting controls refers to the built-in capability to directly import and use data from Microsoft Excel spreadsheets or comma-separated value files as data sources for generating reports. This allows developers to integrate reporting functionality into their desktop applications without needing intermediate data transformations or external database connections. It simplifies the development workflow by supporting widely used formats, ensures compatibility with existing business data, and reduces the need for additional parsing or data handling logic. The result is faster report generation and easier access to commonly used data formats.
Several .NET 9 WPF reporting controls offer Excel / CSV data connectivity including:
For an in-depth analysis of features and price, visit our comparison of .NET 9 WPF reporting controls.
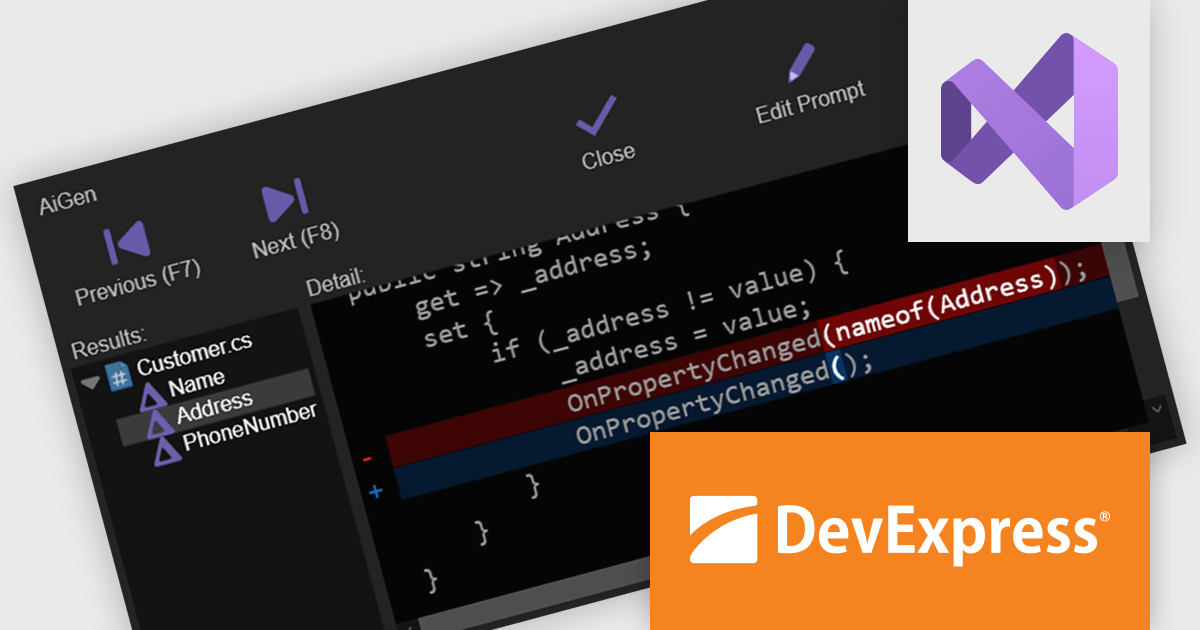
CodeRush Ultimate is a Visual Studio extension designed to improve developer productivity and creativity. It empowers you to generate sophisticated code, automate tedious tasks, and navigate your codebase effortlessly, all while boosting code quality and readability. By eliminating repetitive coding and providing intelligent assistance, CodeRush Ultimate frees you to focus on the big picture, helping you deliver more features faster and with higher quality.
The CodeRush Ultimate 25.1 update adds AiGen - an integrated AI tool that allows developers to generate, refactor, and update code using everyday language. By embedding this functionality directly within CodeRush and Visual Studio, AiGen offers immediate, context-aware code suggestions without the need for external tools or services. This update is designed to improve productivity and reduce development time, while keeping everything inside the familiar confines of your existing development environment.
To see a full list of what's new in version CodeRush Ultimate 25.1, see our release notes.
CodeRush Ultimate is licensed per developer and is available as a Perpetual License with a 12 month support and maintenance subscription. See our CodeRush Ultimate licensing page for full details.
CodeRush Ultimate is available to buy in the following products:
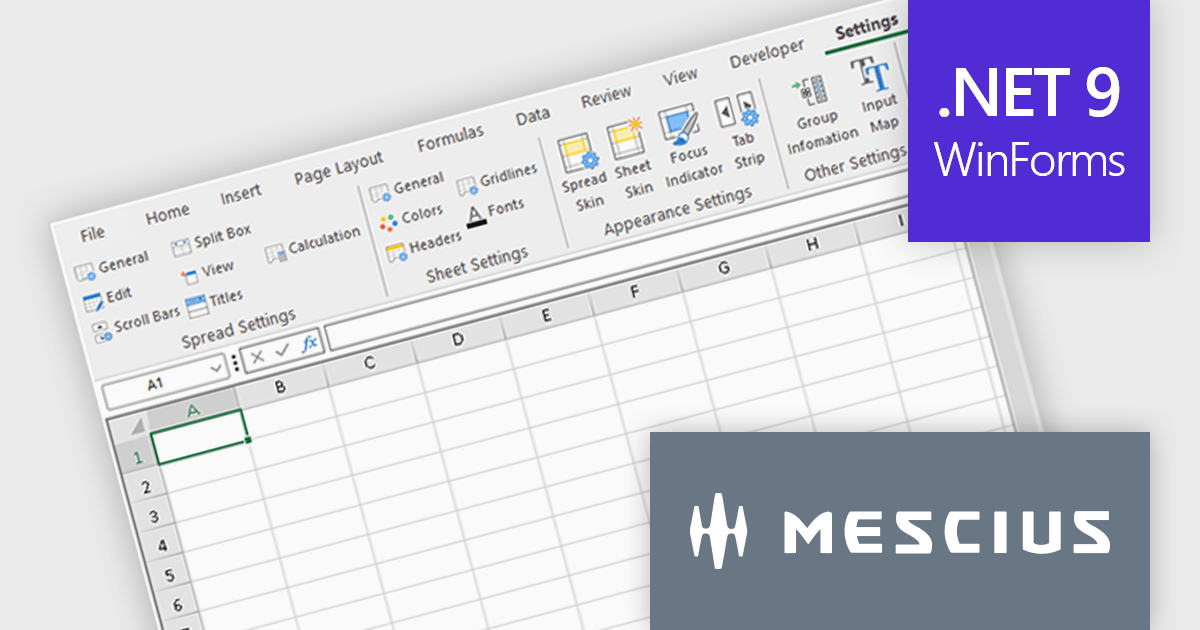
Spread.NET by MESCIUS is a powerful tool for building Excel-like applications in your .NET projects. It lets you create interactive spreadsheets, grids, dashboards, and even forms within WinForms, ASP.NET, and WPF applications. With its rich feature set, including a robust calculation engine, formula support, and Excel compatibility, Spread.NET empowers developers to build data analysis tools, budgeting apps, scientific dashboards, and more, all within the familiar .NET environment.
The Spread.NET 18.2 update refines the RibbonBar in WinForms to improve the efficiency and clarity of UI design during development. With expanded icon visibility, developers can more easily access and identify commands, reducing visual ambiguity and speeding up layout tasks. The addition of new layout options for the collapsed state offers greater control over how the RibbonBar adapts to different form sizes, enabling more responsive and space-efficient interface designs. These improvements help streamline the design-time experience, allowing developers to build cleaner, more functional applications with less manual configuration.
To see a full list of what's new in v18.2, see our release notes.
Spread.NET is licensed per developer and is available as a Perpetual License with a 12 month support and maintenance subscription. We can supply any Spread.NET license including new licenses, maintenance renewals, and upgrade licenses. See our Spread.NET licensing page for full details.
For more information, visit our Spread.NET product page.
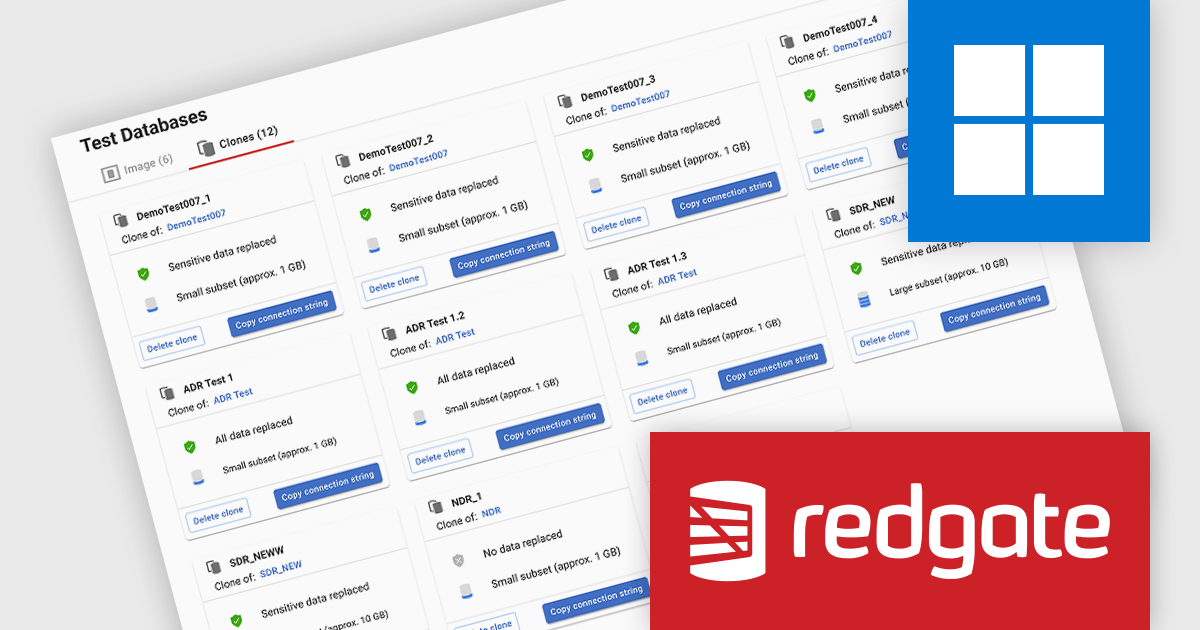
Redgate Test Data Manager is a comprehensive software solution designed to streamline and automate test data management within database environments. It enables teams to provision realistic, production-like data while masking sensitive information to maintain compliance with data privacy regulations such as GDPR and CCPA. With data masking, synthetic data generation, and efficient provisioning, it creates reliable test environments that mirror real-world scenarios. This helps teams detect issues early, streamline debugging, and improve software quality while minimizing production risks and ensuring seamless deployments.
Redgate Test Data Manager significantly accelerates data provisioning for software developers by enabling rapid, self-service access to compliant and high-quality test environments. This empowers developers to quickly obtain realistic, production-like data, either on demand or through automated processes, without reliance on manual database administration tasks. By simplifying the data provisioning workflow and minimizing delays, developers can dedicate more time to writing and testing code, thereby shortening development cycles, enhancing collaboration, and ultimately delivering higher quality software to customers more rapidly.
Redgate Test Data Manager is licensed on a capacity model based on the total volume of data in all production databases (priced per TB). You will need to purchase enough licenses to cover the total TB across all your databases and technologies (SQL Server, Oracle, Postgres SQL and MySQL). See our Redgate Test Data Manager licensing page for full details.
For more information, visit our Redgate Test Data Manager product page.
Stimulsoft Dashboards.WIN is a versatile suite of tools for crafting interactive data visualizations for web and desktop applications. It empowers developers to embed intuitive dashboards across various platforms, using platform-specific components or a centralized cloud designer. With data analysis elements, customization options, and pre-built templates, Stimulsoft Dashboards helps you transform complex data into clear, actionable insights for any audience.
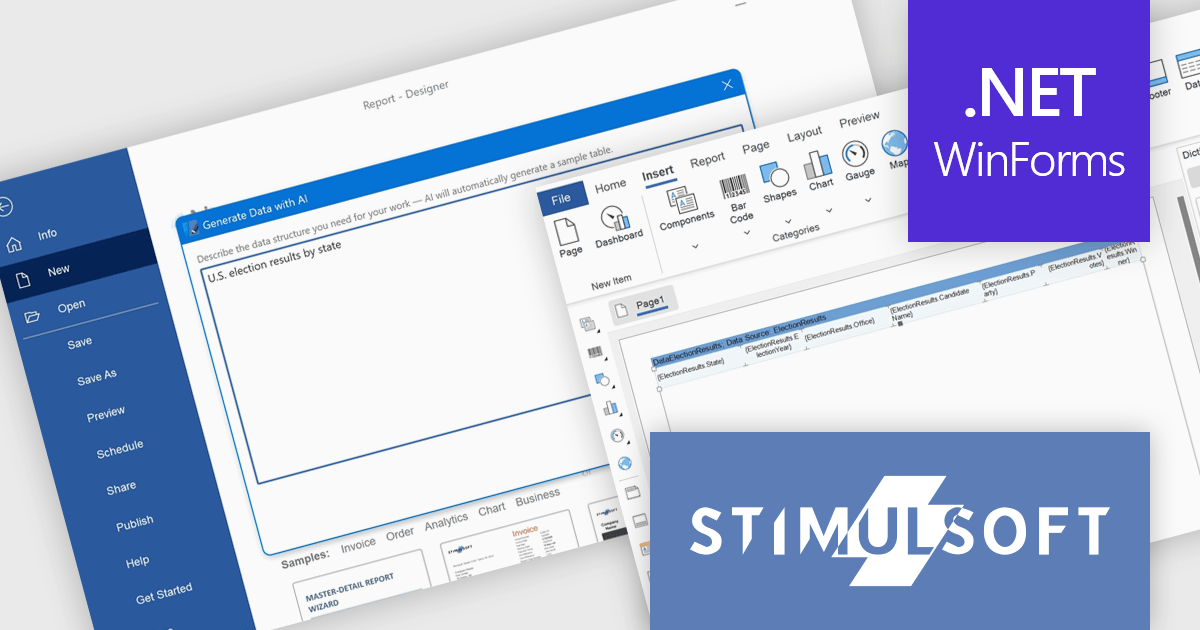
The latest Stimulsoft Dashboards.WIN update introduces AI-powered data generation, enabling developers to quickly create realistic sample datasets using natural language prompts directly within the report designer. This improves the prototyping process by removing the need for manual data setup or external demo files, allowing for faster iteration, testing, and visualization of report layouts.
Stimulsoft Dashboards.WIN is licensed per developer and is available as a perpetual license with 1 year support and maintenance. See our Stimulsoft Dashboards.WIN licensing page for full details.
Stimulsoft Dashboards.WIN is available individually or as part of Stimulsoft Ultimate.
聯繫電話: (888) 850 9911
傳真: +1 770 250 6199


