


官方供應商
我們作為官方授權經銷商,直接提供超過200家開發廠家所發行超過1000個的產品授權給您。
請參閱我們所有的品牌。

TreeLists in UI suites are specialized components designed to display hierarchical, self-referencing data in a tabular format with expandable and collapsible rows. They combine the structure of a tree view with the functionality of a data grid, offering built-in features such as sorting, filtering, editing, and paging. This makes them ideal for scenarios where complex relationships must be presented clearly, such as organization charts, project task structures, file directories, or product categories. Their intuitive layout and powerful data management capabilities help streamline workflows and enhance the user experience in enterprise and business applications.
Several jQuery UI suites feature a treelist control including:
For an in-depth analysis of features and price, visit our jQuery UI Suites comparison.
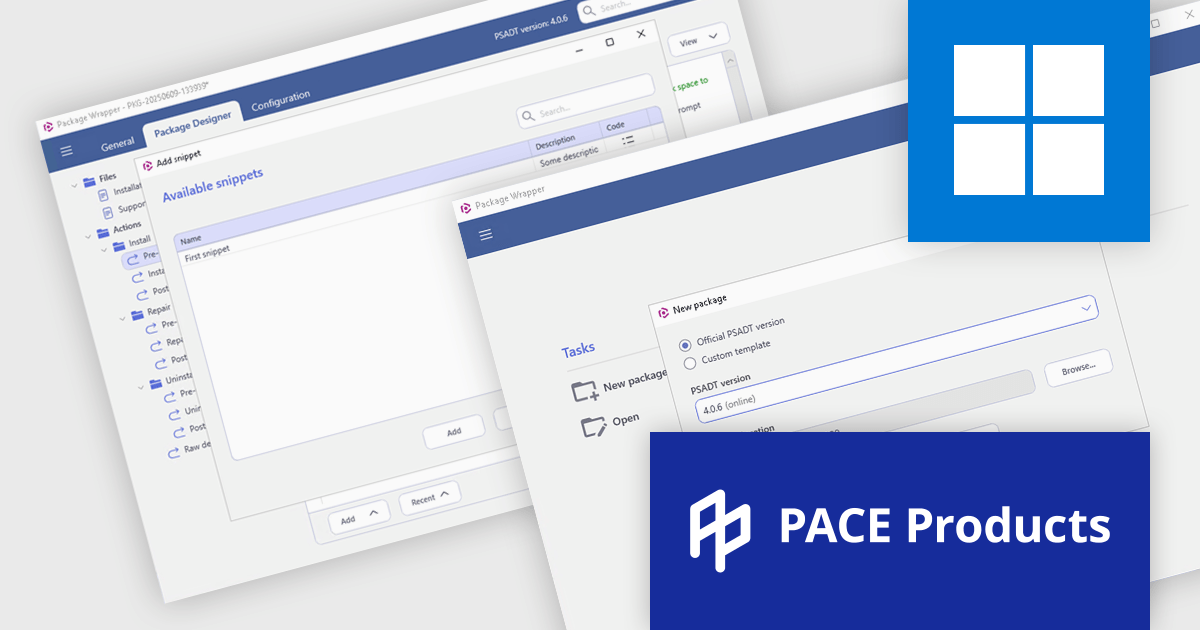
PACE Suite by Infopulse is an application packaging tool that streamlines the creation, editing, and deployment of software installers. It supports various formats like MSI, MSIX, and AppX, and allows for capturing installations, customizing packages, and automating quality checks. Additionally, PACE Packager Hub, a companion product, provides workflow management and team collaboration functionalities for efficient application packaging operations.
The PACE Suite 6.5 update introduces full support for PSAppDeployToolkit (PSADT) version 4, allowing users to work seamlessly with the toolkit's updated syntax and structural changes. PSADT v4 represents a significant shift in how deployment scripts are written and managed, and this update ensures that users can adopt those changes without disruptions. By aligning with the latest version, PACE Suite enables more reliable script execution, easier maintenance of deployment logic, and future-proof compatibility with evolving enterprise deployment standards. This is particularly valuable for IT teams managing complex software rollouts in Windows environments.
To see a full list of what's new in 6.5, see our release notes.
PACE Suite is licensed per user and is available as both subscription and perpetual licenses. See our PACE Suite licensing page for full details.
For more information, visit our PACE Suite product page.
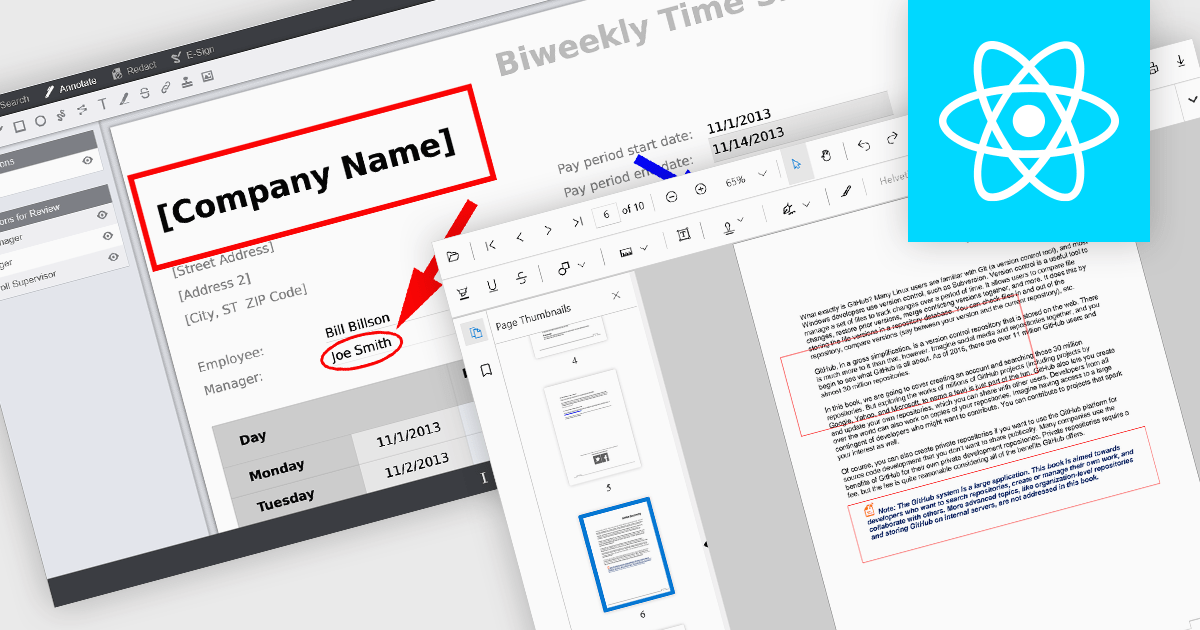
Rectangle annotations in PDF viewer components enable users to highlight, mark, or comment on specific areas within a PDF document by drawing rectangular shapes. This feature is commonly used for reviewing documents, collaborating on content, or emphasizing sections in technical or legal workflows. It enhances user interactivity within the viewer, allowing for visual references and context-specific notes without altering the original document content.
Several React PDF viewer controls offer rectangle annotations including:
For an in-depth analysis of features and price, visit our React PDF viewer controls comparison.
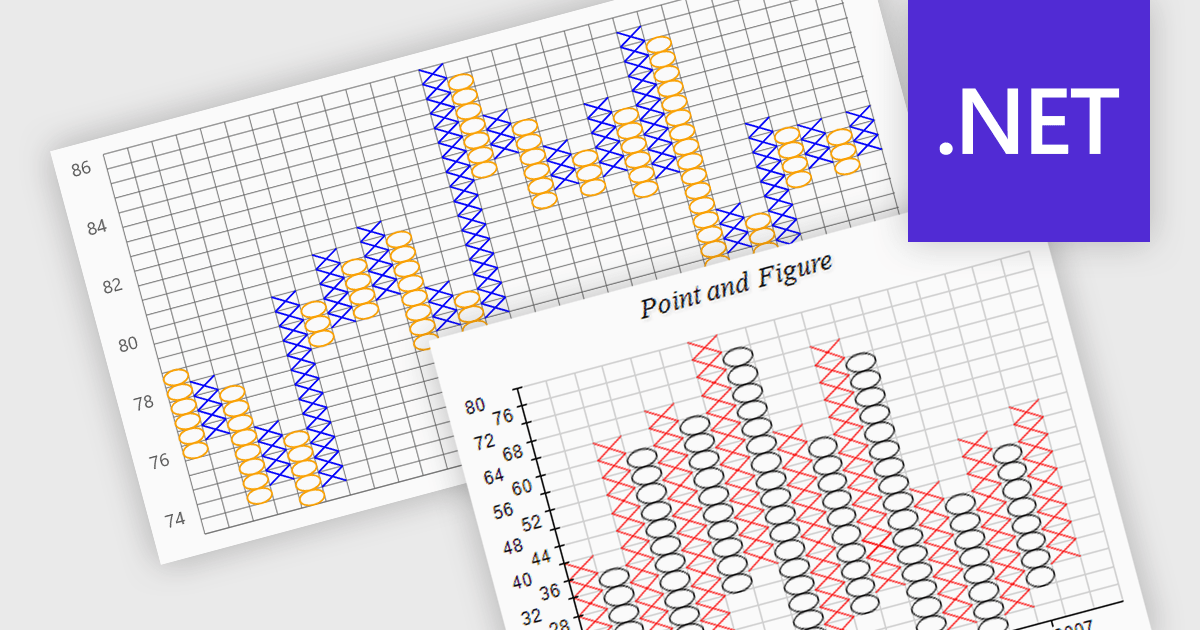
A point and figure (P&F) chart is a financial charting technique used to track price movements by plotting directional changes in price without reference to time. It focuses exclusively on significant price changes, filtering out minor fluctuations to highlight clear trends and reversals. Instead of plotting prices continuously, it uses columns of Xs and Os to represent rising and falling prices, respectively, based on predefined price increments. This chart type provides a straightforward view of supply and demand dynamics, making it particularly effective for identifying support and resistance levels, breakout patterns, and trend direction. Its simplicity helps traders and analysts focus on essential price action, reducing the noise found in traditional time-based charts.
Several .NET charting components provide you with point and figure charts, including:
For an in-depth analysis of features and price, visit our comparison of .NET chart components.
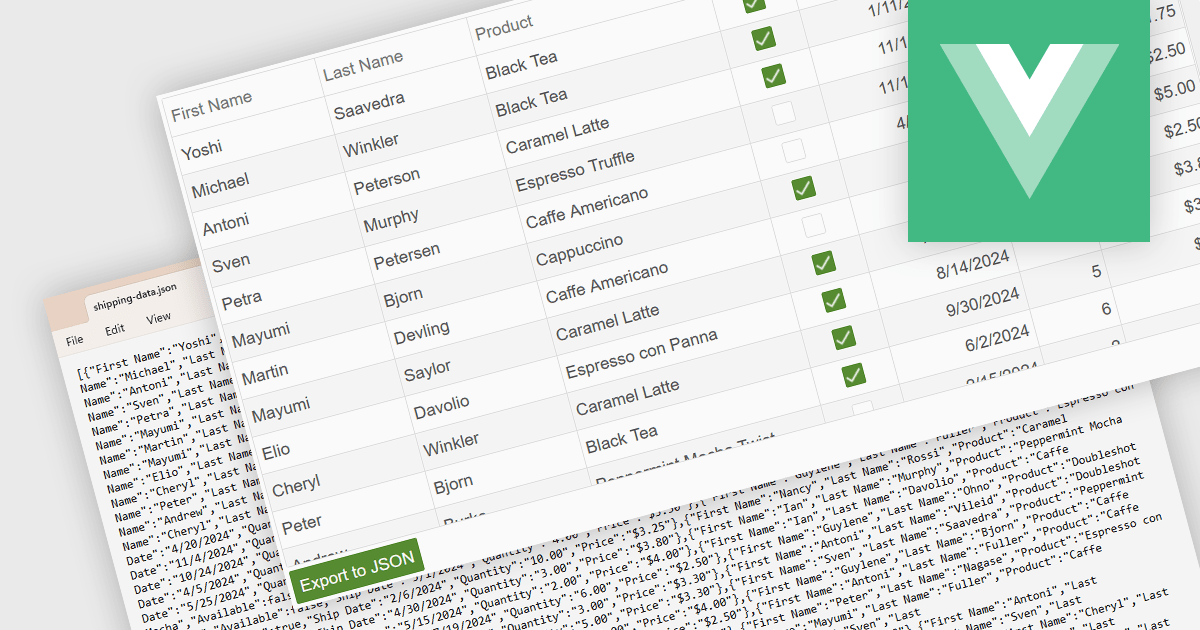
Exporting a data grid to JSON format is a common feature in modern web-based data tools that involves converting the structured data displayed in a grid, such as rows and columns representing records and fields, into JavaScript Object Notation (JSON), a lightweight, text-based format commonly used for data interchange. This process enables the grid's contents to be saved in a machine-readable structure that preserves the hierarchy and attributes of the data, making it easily consumable by web services, APIs, or other applications. The benefits of exporting to JSON include its compatibility with a wide range of programming environments, ease of integration with frontend and backend systems, and suitability for transmitting data across networked systems or persisting it for later use in client-side operations or remote storage.
Several Vue.js grid controls allow you to export to JSON, including:
For an in-depth analysis of features and price, visit our comparison of Vue.js grid controls.
聯繫電話: (888) 850 9911
傳真: +1 770 250 6199


