


官方供應商
我們作為官方授權經銷商,直接提供超過200家開發廠家所發行超過1000個的產品授權給您。
請參閱我們所有的品牌。
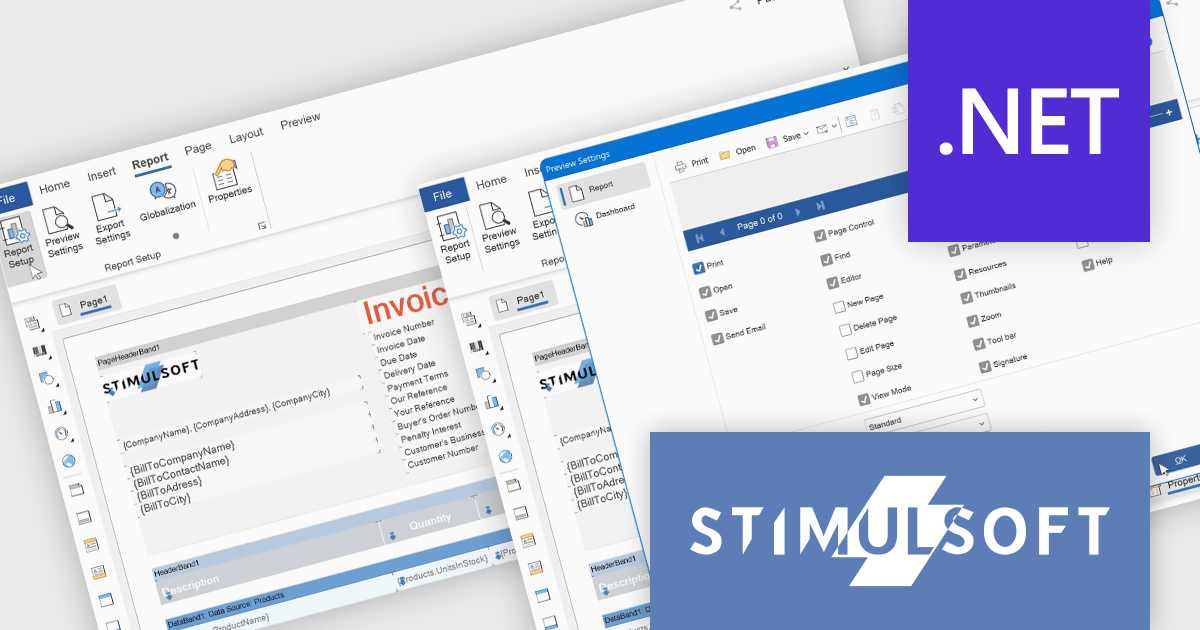
Stimulsoft Reports.WEB is a cross-platform reporting solution designed for integration within web applications. It leverages a client-server architecture for report generation, viewing, printing, and exporting directly in web browsers. Its powerful .NET report engine offers efficient report processing, a user-friendly HTML5 report designer for building reports with various data sources and visualizations, and an interactive HTML5 viewer for seamless report display within web applications. This integration allows developers to implement robust reporting functionalities without browser plugins or additional client-side dependencies.
The Stimulsoft Reports.WEB 2025.3.1 update introduces a new Report tab that improves the efficiency of report design by centralizing essential configuration tools within a single, accessible workspace. This tab integrates key functions such as Report Options, Preview Settings, Export Settings, and Globalization, allowing developers to manage the core aspects of their report templates without switching between multiple panels or views. By streamlining access to these commonly used features, the update enhances workflow speed, reduces setup complexity, and supports more consistent report output across different environments.
To see a full list of what's new in 2025.3.1, see our release notes.
Stimulsoft Reports.WEB is licensed per developer and is available as a perpetual license with 1 year support and maintenance. See our Stimulsoft Reports.WEB licensing page for full details.
Stimulsoft Reports.WEB is available individually or as part of Stimulsoft Ultimate.
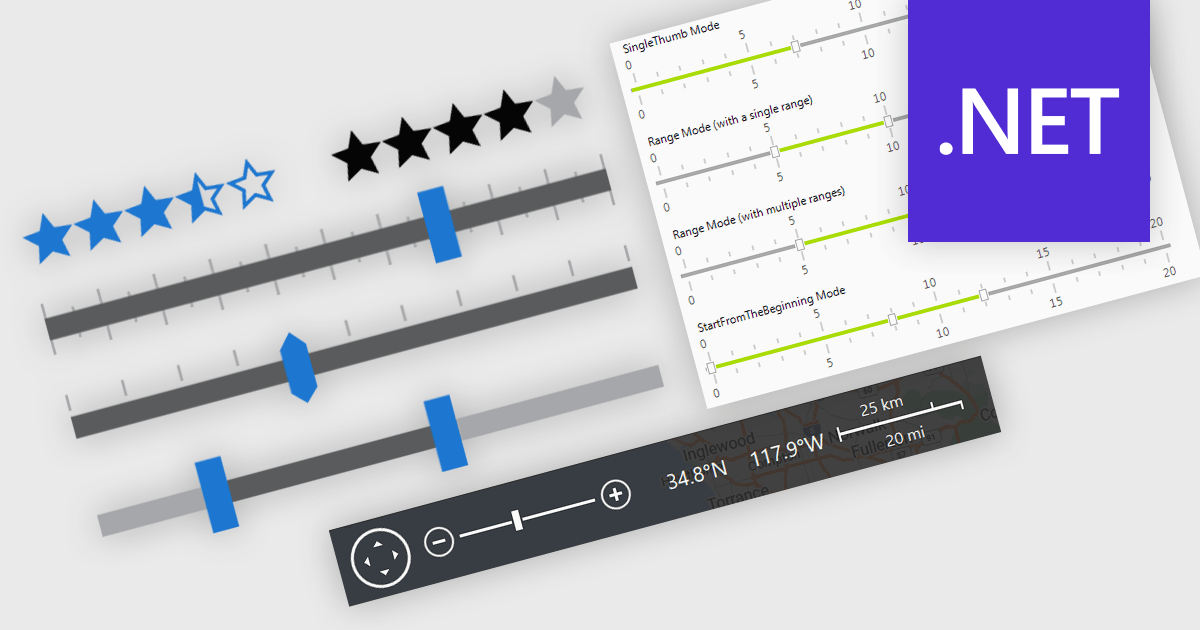
In .NET applications that require data editing, visual UI elements play a vital role in improving how users input and adjust data. For data entry such data visualization components as trackbars, range sliders, zoom controls, and rating elements offer an interactive alternative to text fields or dropdowns, making data input and feedback mechanisms more intuitive and precise. Whether it's setting numerical thresholds or filtering data sets based on user-defined limits, adjusting the view scale of charts, timelines, or graphical data displays, or quickly capturing feedback, these controls contribute to a more responsive and user-friendly interface. These components are especially valuable in scenarios that require fine-tuned input or subjective scoring, helping users make quick adjustments without disrupting the end-user's workflow.
Common features include:
For an in-depth analysis of features and price, visit our .NET data editors comparison.
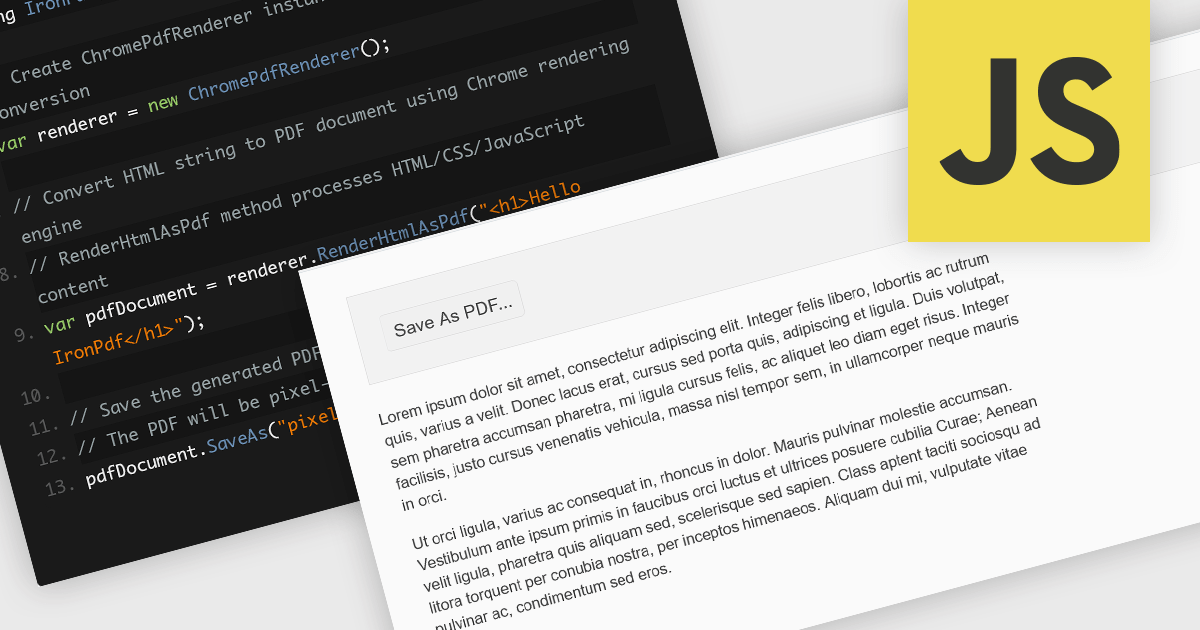
Converting HTML files to PDF within PDF component libraries offers an easy way to capture richly styled, web-based content in a fixed, shareable format. This feature typically uses a browser-like rendering engine to accurately represent CSS, images, fonts, and links, ensuring that what you see in the browser is preserved in the document. It's especially useful for generating reports, invoices, documentation, and static snapshots of dynamic web pages, combining familiarity of web-based layout with the portability and consistency of PDFs.
Several JavaScript PDF controls offer HTML fo PDF conversion including:
For an in-depth analysis of features and price, visit our JavaScript PDF controls comparison.
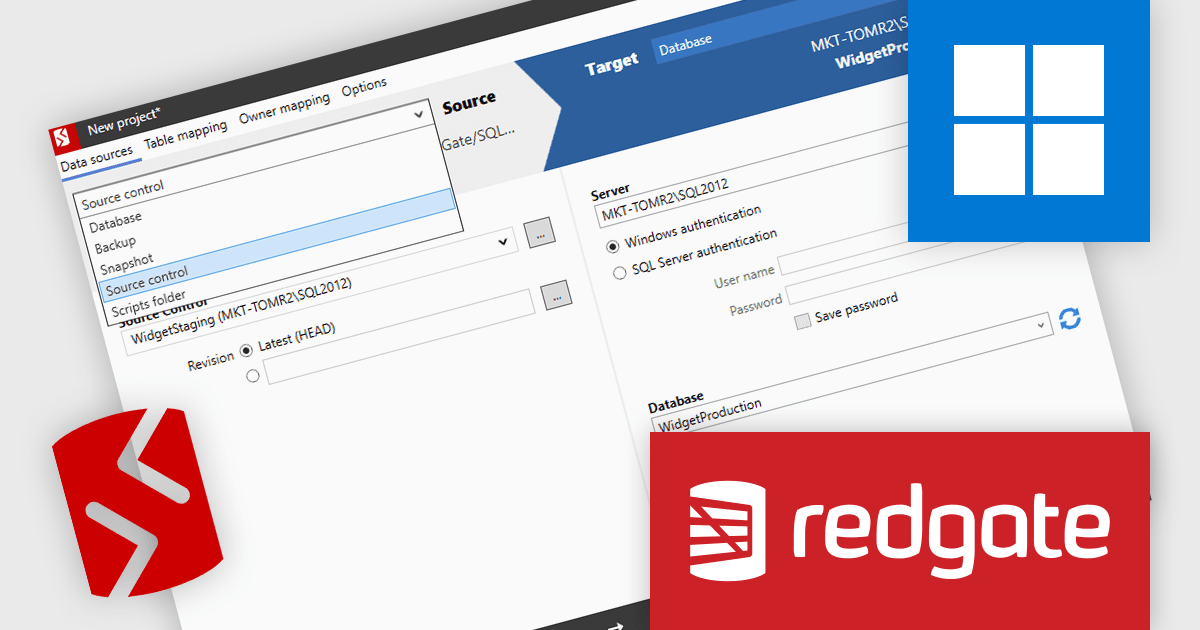
SQL Compare by Redgate Software simplifies SQL Server schema comparison and synchronization, helping teams maintain consistency and improve deployments. It automates change detection, reduces errors, and improves efficiency with advanced object filtering. Used across industries like finance, healthcare, and e-commerce, it supports database version control, troubleshooting, and DevOps integration for reliable database management.
Redgate SQL Compare streamlines the resolution of production database issues by allowing developers to compare the live environment directly with a backup, snapshot, or source-controlled version. This capability enables precise identification of schema differences and supports the deployment of individual objects to correct issues quickly and safely. By avoiding the need for full database restores or broad, high-risk deployments, it reduces downtime and minimizes disruption to critical systems. For static data corrections, integration with SQL Data Compare further enhances the ability to address problems efficiently, ensuring production stability while maintaining alignment with development workflows.
SQL Compare is licensed per developer and is available as a 1, 2 or 3 year subscription license which includes full support plus all major versions of the software released during the subscription period. For full details, see our SQL Compare licensing page.
For more information, visit our SQL Compare product page.
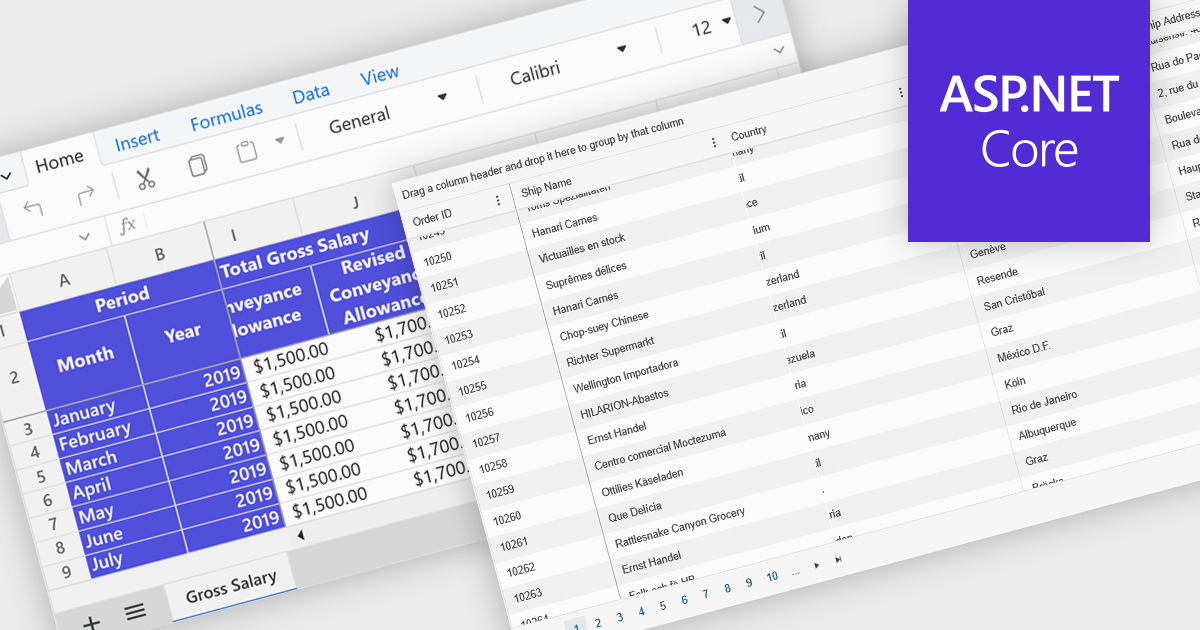
Freeze Panes in spreadsheets is a feature that keeps selected rows or columns visible while you scroll through your data. This helps maintain context in large spreadsheets by keeping headers or labels in view, making it easier to read, analyze, and enter information accurately. Common use cases include freezing the top row in a budget sheet to keep month names visible, or locking the first column to see item names while reviewing data across many columns. It is especially valuable in financial reports, sales tracking, and project management tools where clarity and precision are essential.
Several ASP.NET Core spreadsheet controls offer freeze pane support including:
For an in-depth analysis of features and price, visit our ASP.NET Core spreadsheet controls comparison.
聯繫電話: (888) 850 9911
傳真: +1 770 250 6199


