


官方供應商
我們作為官方授權經銷商,直接提供超過200家開發廠家所發行超過1000個的產品授權給您。
請參閱我們所有的品牌。
Telerik UI for WPF is a comprehensive suite of over 150 user interface components designed for Windows Presentation Foundation, enabling developers to build modern, high-performance desktop applications. It includes controls like data grids, charts, schedulers, and editors, optimized for seamless integration and support for MVVM (Model-View-View-Model) patterns. With features like built-in theming, responsive layouts, and customizable styling, it simplifies the creation of visually appealing, intuitive interfaces. Ideal for enterprise-grade or consumer-facing apps, Telerik UI for WPF accelerates development while ensuring professional-quality results.
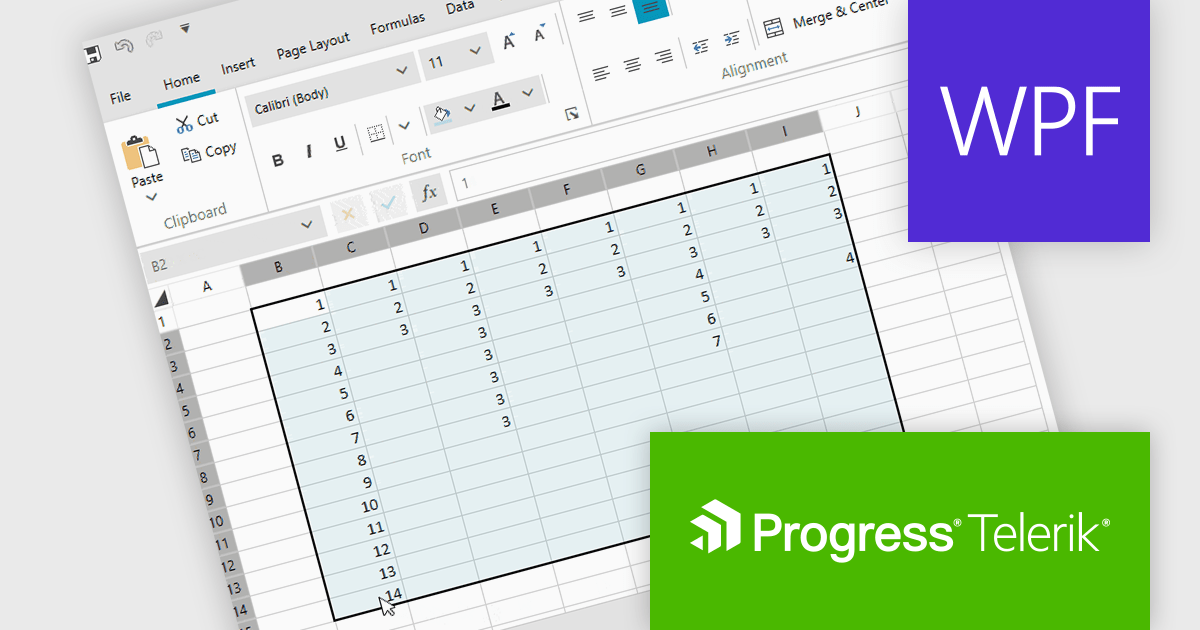
Telerik UI for WPF now supports a 'CurrentRegion' selection property and corresponding UI command in its Spreadsheet control, enabling quick selection of adjacent, non-empty cells around the active cell. This feature replicates Microsoft Excel’s behavior, making it easier to apply formulas, format ranges, or export grouped data without manually selecting each cell. By automatically identifying relevant data regions, it enhances efficiency and creates a smoother, more intuitive user experience.
Telerik UI for WPF is licensed per developer and has two licensing models: an annual Subscription License and a Perpetual License. The Subscription license provides access to the latest product updates, technical support, and exclusive benefits for a flat annual fee, and must be renewed to continue using the software. The Perpetual license is a one-time purchase granting access to the current released version and includes a one-year subscription for product updates and technical support. After this initial period, users can choose to renew the subscription element to continue receiving updates and support; otherwise, they may continue using the installed version available during their active subscription term but will forgo future updates and support. See our Telerik UI for WPF licensing page for full details.
Telerik UI for WPF is available individually or as part of the following products:
Remote Desktop Manager (RDM) by Devolutions (available in Windows, macOS or Linux editions) is a centralized platform designed for managing and securing remote connections and credentials for authorized users across various environments. It supports an extensive list of technologies, including remote desktops, virtual private networks (VPNs), and secure shell (SSH) tunnels, and features centralized password vaults, user-specific vaults, and administrative password sharing. This cross-platform management tool also allows you to perform audits and create reports, as well as offering mobile and offline access, and integrated virtualization consoles. RDM provides a comprehensive solution for IT professionals and developers who need to streamline access to servers, virtual machines, and network devices.
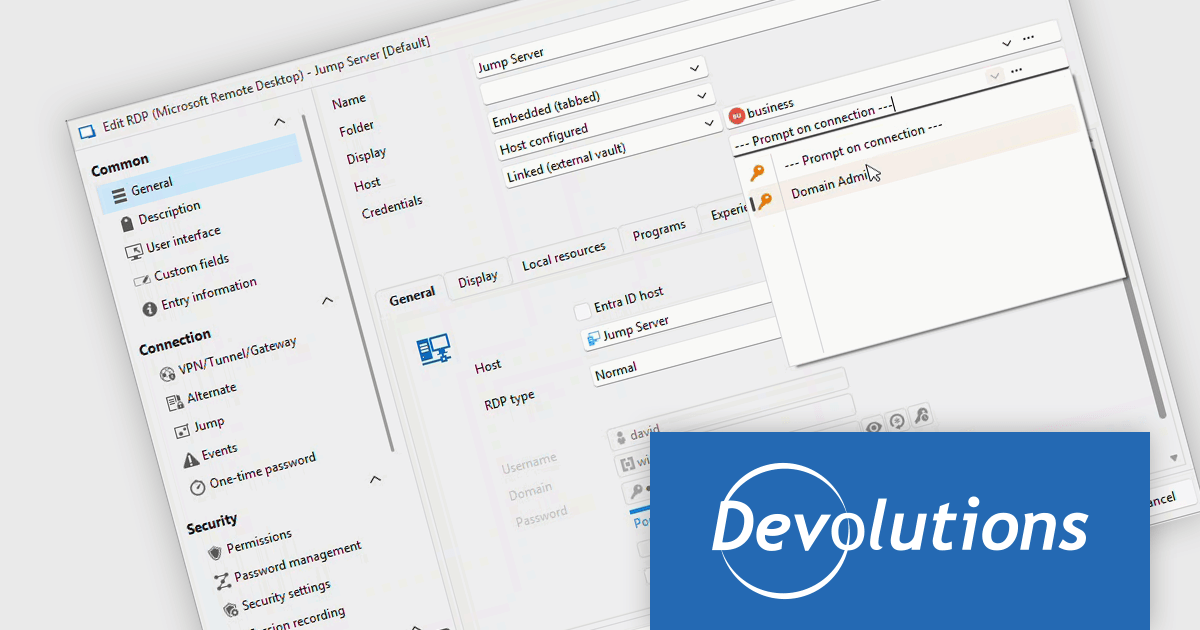
Remote Desktop Manager now includes a "Linked (external vault)" mode, which provides an alternative means of injecting credentials against sessions. Currently limited to SQL Server, this feature allows the secure selection of credentials from another shared vault, hosted outside of RDM. This capability simplifies credential update processes, as changes made in the external vault are automatically reflected in RDM, and enhances security by enabling centralized credential management, promoting consistency and compliance across systems whilst ensuring that sensitive information remains within controlled vaults.
Remote Desktop Manager is available as part of the Devolutions Starter Pack, which is licensed per user and offered as an annual subscription. See our Remote Desktop Manager licensing page for full details.
For more information, visit our Remote Desktop Manager product page.
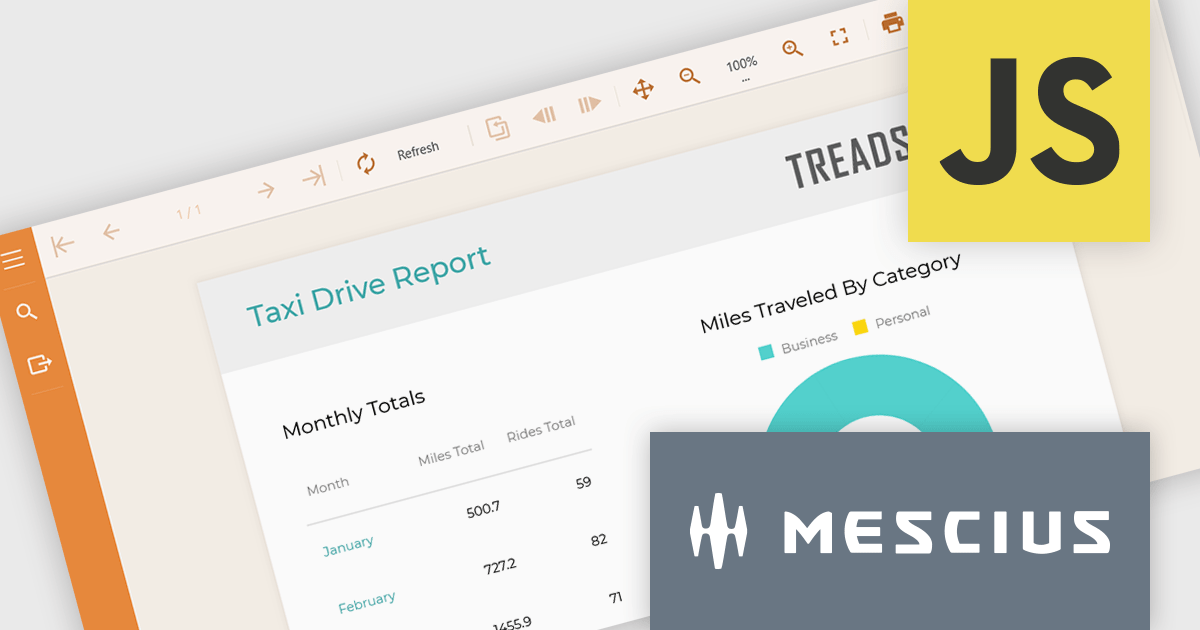
ActiveReportsJS is a powerful, lightweight reporting tool designed to seamlessly integrate advanced reporting capabilities into any JavaScript application. ActiveReportsJS enables developers to create, view, export, and print richly formatted reports entirely on the client side - with zero server dependencies.
On July 24, 2025 at 11:00 AM EDT, MESCIUS (formerly GrapeCity) will be presenting a CodeClinic Live Webinar to demonstrate how you can include the ActiveReportsJS Report Viewer and Report Designer in your application. From implementing the controls to a step-by-step process on how to build reports, by the end, you'll have all of the tools needed to incorporate an advanced reporting solution in your web applications.
Register for the LIVE webinar today, and mark your calendar for July 24.
DevExpress (Developer Express) is an award-winning software development company based in the United States. It produces coding assistance tools and components for Delphi, C++ Builder and Microsoft Visual Studio developers. The major part of its product line is VCL, .NET WinForms and ASP.NET components that replicate the UI of Microsoft Windows and Microsoft Office applications.
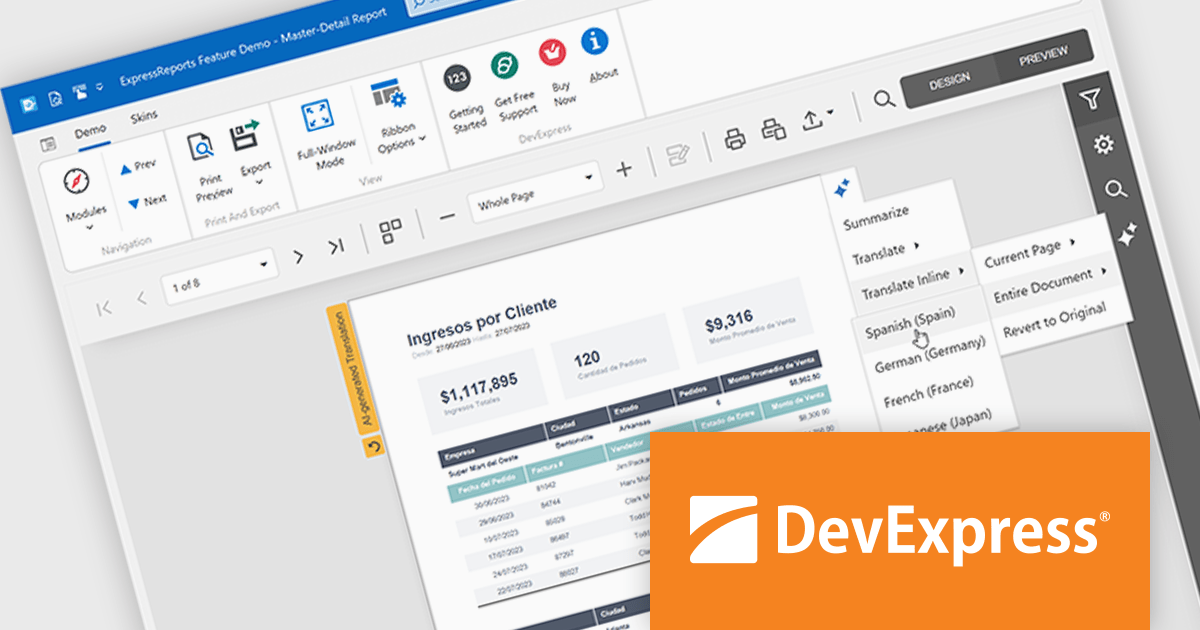
With the recent release of version 25.1, the entire DevExpress product line has undergone significant changes:
This powerful new functionality comes at a higher price. DevExpress has implemented price raises across all product lines for both new licenses and renewals. To view all of the current, updated prices, see the comprehensive product list on the DevExpress Brand Page.
**Note: If you have a current, valid quote from ComponentSource at the previous pricing, the price will be honored up to that quote's expiration date.
The DevExpress VCL Subscription + (DevExpress VCL Subscription Plus) includes:
DevExpress Reporting is available to buy in the following products:
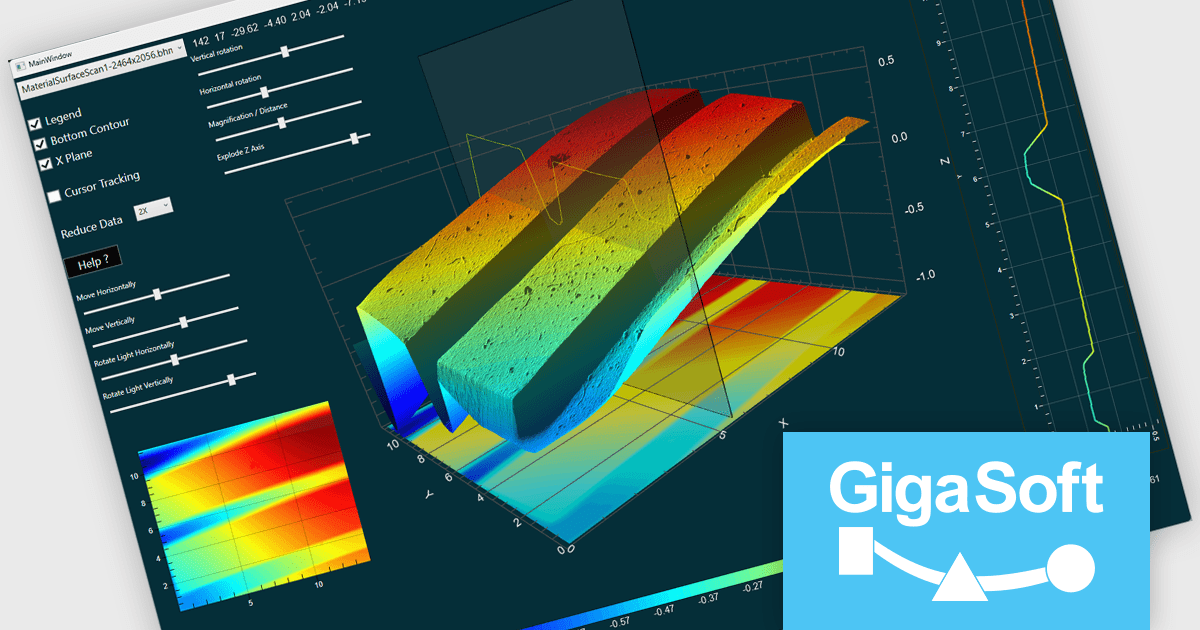
Gigasoft ProEssentials is a robust charting library for Windows development, providing a wide array of 2D and 3D chart types. The product offers a versatile suite of components, such as Graph, Scientific Graph, and 3D Scientific Graph, enabling the creation of sophisticated visualizations. It's extensive support for various platforms and development environments, including WPF, WinForm, and integration with popular IDEs like Visual Studio, enhances flexibility and empowers developers to efficiently visualize data within their applications.
The Gigasoft ProEssentials provides Direct3D rendering, significantly enhancing scene construction performance. By leveraging the parallel processing power of the GPU, this feature accelerates the rendering process compared to traditional CPU-based methods. This results in faster visualization of complex scenes, improved responsiveness, and a more efficient use of system resources, ultimately enabling developers to create more performant and visually impressive applications.
Gigasoft ProEssentials is licensed per developer and is available as a perpetual license with free technical support and maintenance for the life of the version. See our Gigasoft ProEssentials licensing page for full details.
For more information, visit our Gigasoft ProEssentials product page.
聯繫電話: (888) 850 9911
傳真: +1 770 250 6199


