


官方供應商
我們作為官方授權經銷商,直接提供超過200家開發廠家所發行超過1000個的產品授權給您。
請參閱我們所有的品牌。

GroupDocs.Viewer for Node.js via Java is a JavaScript library that allows you to display images and document formats in your web applications without needing to install additional software. It supports a wide range of file formats, including PDF, HTML, XML, Microsoft Word, Visio, Project, metafiles, and images. GroupDocs.Viewer for Node.js is also highly customizable, allowing you to display the whole document or render it partially to speed up the process. You can also view single pages, a specific cell range in a spreadsheet, or even render an individual document layer in formats such as, PDF and CAD.
The GroupDocs.Viewer for Node.js V24.8 release introduces a significant enhancement in image handling. By leveraging the embedded EXIF Orientation metadata within JPEG files, the library can now automatically rotate and flip images to their correct orientation. This ensures that regardless of how the image was originally captured or stored, it will always be displayed accurately to the viewer. This feature not only improves the user experience but also streamlines the development process by eliminating the need for manual image adjustments.
To see a full list of what's new in V24.8, see our release notes.
GroupDocs.Viewer for Node.js via Java is offered as Developer Small Business, Developer OEM, Site Small Business, and Site OEM licenses catering to a range of business needs. Licenses are perpetual, and include 1 year of support and maintenance. Subscription renewals are also available. See our GroupDocs.Viewer for Node.js via Java licensing page for full details.
GroupDocs.Viewer for Node.js via Java is available in the following products:
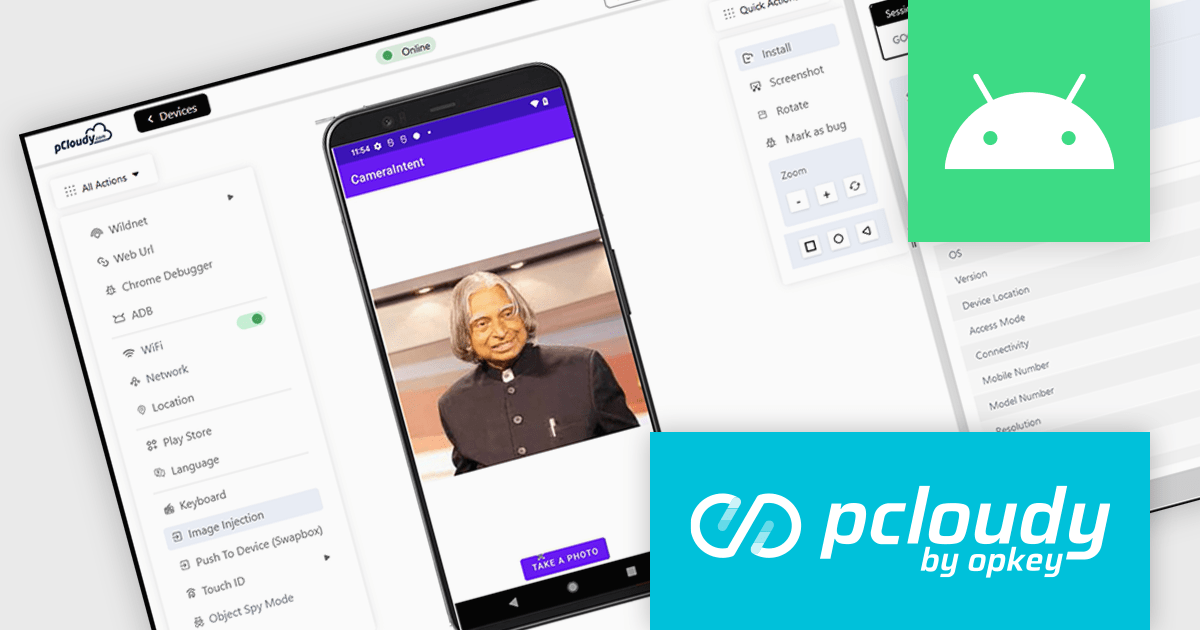
Pcloudy is a unified app testing platform that helps developers and testers ensure the quality and functionality of their applications across a wide range of devices and browsers. It provides a cloud-based infrastructure for manual and automated testing, offering access to thousands of real devices and browser combinations.
The Pcloudy 6.11 release improves the testing of image capture features in Android apps. It now supports CameraX Jetpack, a library that streamlines the process of capturing images and videos across various Android devices. These enhanced image capture capabilities offer significant benefits for developers testing their apps, including easier integration, improved compatibility and faster testing cycles.
To see a full list of what's new in 6.11, see our release notes.
Pcloudy is offered as a 1 Year Subscription, licensed per user, per parallel session. Licenses are available for Manual or Automated Testing, for Web or Mobile. See our Pcloudy licensing page for full details.
For more information, visit our Pcloudy product page.

Infragistics Ignite UI for React is a comprehensive UI component library designed to accelerate the development of modern web applications. It offers a rich collection of high-performance, customizable components, including data grids, charts, scheduling, and more. The library's intuitive API and comprehensive documentation make it easy for developers to create visually appealing and interactive user interfaces. Key benefits include improved developer productivity, enhanced application performance, and access to a wide range of pre-built components.
The Ignite UI for React 18.7.0 release adds a new banner component that offers a versatile and effective way to communicate important information to your application's users. By strategically placing banners within your application's layout, you can ensure that crucial messages are prominently visible without obstructing the user's primary workflow. Banners can be customized to include specific actions or calls to action relevant to the message's context, empowering users to respond or take further steps. This flexibility makes banners an invaluable tool for delivering timely and engaging communications within your React-based applications.
To see a full list of what's new in version 18.7.0, see our release notes.
Infragistics Ignite UI for React is part of Infragistics Ignite UI which is licensed per developer and is available as a perpetual license with a 1, 2 or 3 year support and maintenance subscription. See our Infragistics Ignite UI licensing page for full details.
Infragistics Ignite UI for React is available to buy in the following products:
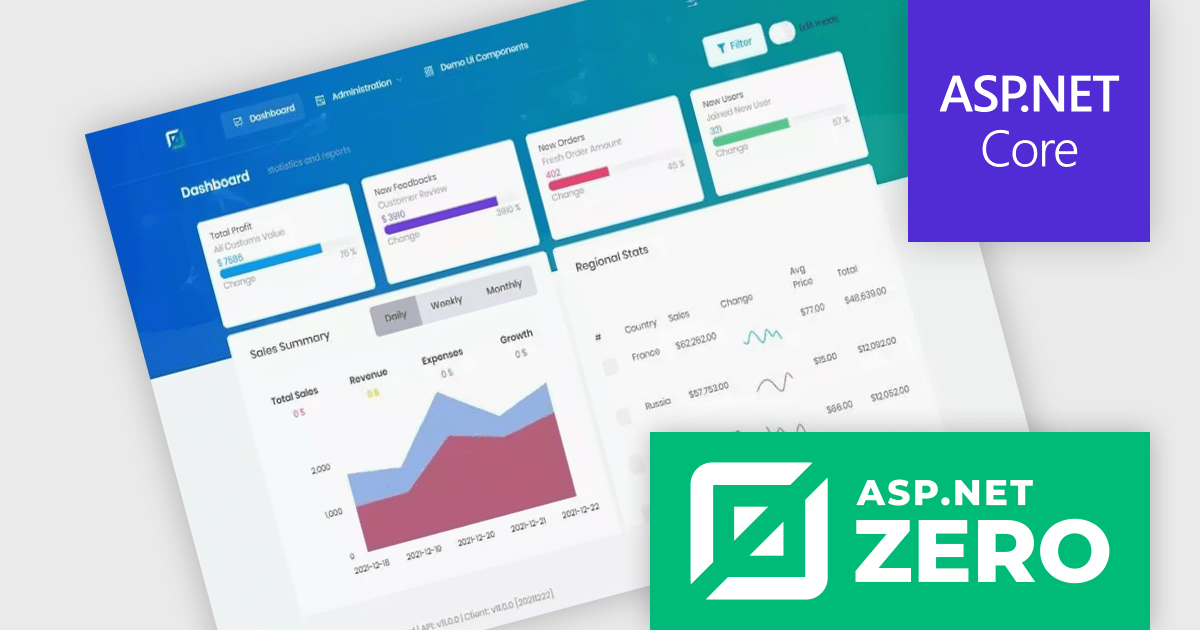
ComponentSource, a leading provider of software development tools, has partnered with ASP.NET Zero (by Volosoft), a software solution provider that creates reusable software libraries/frameworks/tools, distributed architectures/systems, multi-threaded, and real-time applications. The ASP.NET Zero team has extensive experience with Microsoft technologies, JavaScript frameworks, development and design tools, database management systems and mobile development platforms.
ASP.NET Zero is a robust web application development framework specifically designed to expedite the creation of modern, high-performing web applications. It functions as a pre-configured foundation, akin to a pre-built structure with essential utilities already in place. This enables developers to concentrate their efforts on crafting the unique functionalities that differentiate their application.
ASP.NET Zero is licensed based on the number of developers using the framework and the number of products being developed. See our ASP.NET Zero licensing page for full details.
For more information, visit our ASP.NET Zero publisher page.
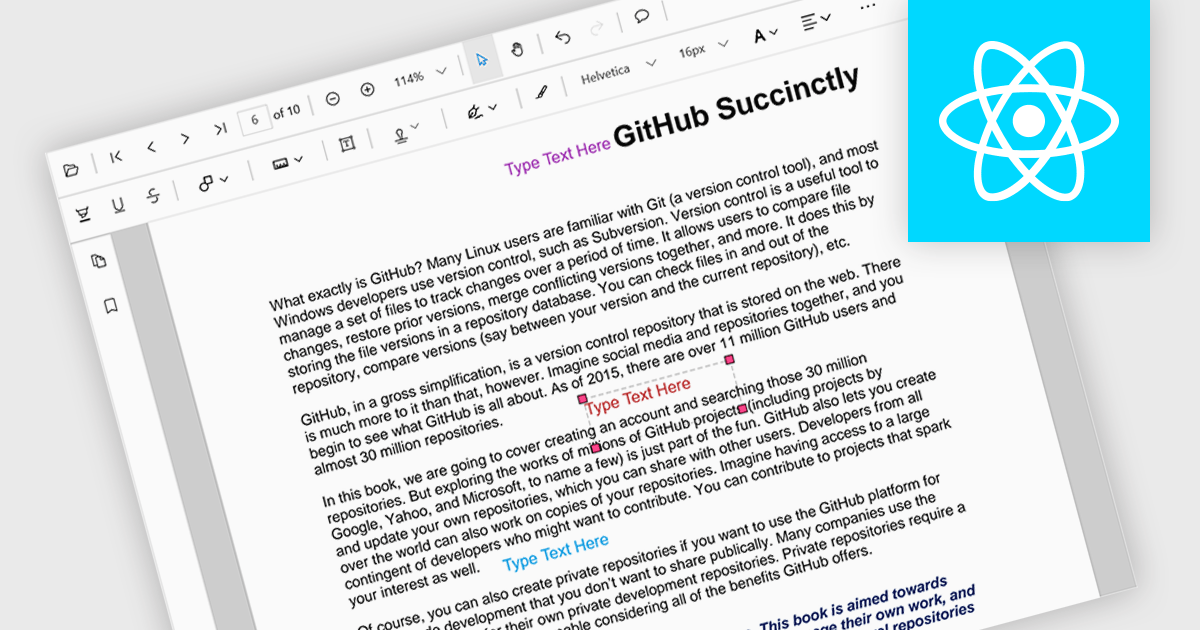
Free text annotations are textual comments or notes added to a document or image, independent of specific fields or structures. Unlike structured annotations that conform to predefined formats (e.g. highlighting, strikethrough), free text annotations provide flexibility for users to express their thoughts, questions, or observations in a more open-ended manner. This allows for richer and more personalized interactions with the content, making it valuable for tasks such as note-taking, research, and collaboration.
Several React PDF viewer controls offer support for free text annotations including:
For an in-depth analysis of features and price, visit our React PDF viewer controls comparison.
聯繫電話: (888) 850 9911
傳真: +1 770 250 6199


