


官方供應商
我們作為官方授權經銷商,直接提供超過200家開發廠家所發行超過1000個的產品授權給您。
請參閱我們所有的品牌。

ActiveReportsJS is a reporting tool for web applications that allows developers and report authors to easily design and display reports within their applications. With a wide range of features, such as drill-down, runtime data filtering, and parameter-driven reports, as well as compatibility with popular frameworks, ActiveReportsJS simplifies the process of creating and managing reports.
A Tablix is a versatile report item that acts as a unified platform for displaying data in table, matrix (cross-tab), and list formats. It offers a flexible layout grid with nested rows and columns, allowing you to structure data for easy analysis and visualization. This empowers you to present detailed information, group data by categories, and summarize key metrics, all within a single report element.
In this blog, MESCIUS Technical Engagement Engineer Joel Parks shows you how to use ActiveReportsJS to add a Tablix control to your JavaScript report. Steps include:
Read the full blog and give your users the ability to create flexible reports with the ability to adapt to changing data conditions.
PHP Tools for Visual Studio converts Microsoft's IDE into a complete PHP development environment, increasing productivity with features such as smart code analysis, preemptive code completion, integrated debugging, and project management. This single package combines Visual Studio's familiar interface with industry-standard capabilities, allowing you to easily develop PHP applications and websites.
The PHP Tools for Visual Studio v1.78.19088 release adds support for refactoring private properties. This allows you to seamlessly rename, move, and extract private properties within your PHP project. Refactoring effortlessly transforms your code structure into a tidy and maintainable codebase without breaking anything, all within the familiar Visual Studio environment.
To see a full list of what's new in v1.78.19088, see our release notes.
PHP Tools for Visual Studio is licensed per developer and is available as a perpetual license with 1 year of upgrades and support. See our PHP Tools for Visual Studio licensing page for full details.
For more information, see our PHP Tools for Visual Studio product page.
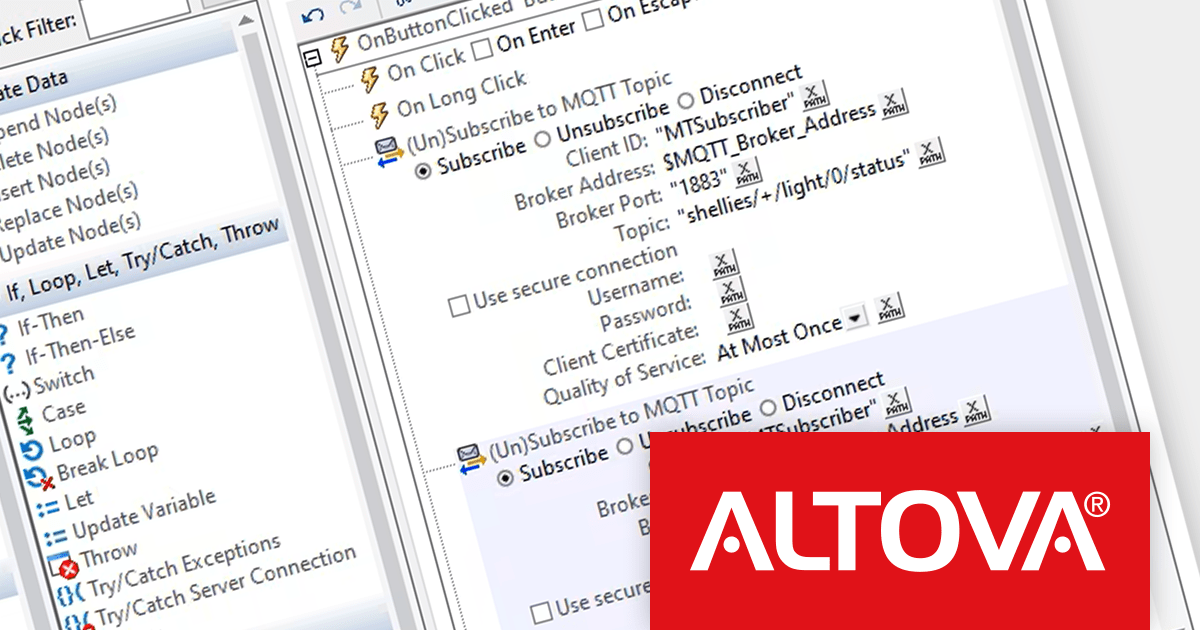
Altova MobileTogether is a rapid app development platform that empowers anyone, regardless of coding experience, to build sophisticated data-driven apps for all mobile and desktop platforms. With its visual UI design, drag-and-drop functionality, and powerful Action Tree programming language, MobileTogether streamlines the development process, enabling you to create custom database apps, integrate with backend systems, and deploy secure solutions swiftly and cost-effectively.
The MobileTogether 9.0 release elevates data intelligence to a new level with seamless integration of MQTT, the ubiquitous messaging protocol of the Internet of Things (IoT). This empowers your apps to join the dynamic dialogue between smart devices, enabling real-time data exchange and transformative control across diverse industries. From monitoring critical equipment in manufacturing to optimizing patient care in healthcare, MobileTogether 9.0 unlocks powerful insights and streamlines workflows, empowering you to orchestrate operations with unprecedented precision and efficiency.
To see a full list of what's new in version 9.0, see our release notes.
MobileTogether is licensed per server core as an annual subscription. See our MobileTogether licensing page for full details.
For more information, visit our MobileTogether product page.
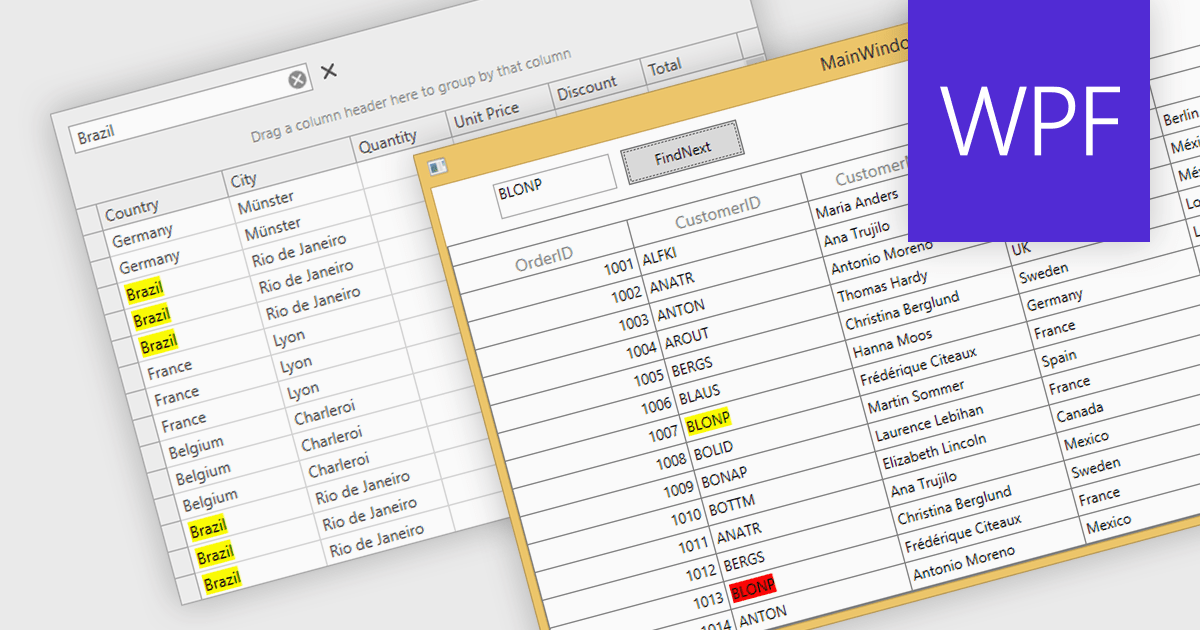
Searching within a grid enables users to quickly find specific data points by entering search criteria. For large datasets, navigating to specific data points can be a monumental task, often requiring time-consuming manual scrolling. Grid search allows users to pinpoint desired data within seconds, boosting productivity and streamlining analysis. This eliminates the need for tedious browsing and empowers users to quickly identify trends, patterns, and outliers, enabling deeper insights and informed decision-making.
Several WPF grids support searching including:
For an in-depth analysis of features and price, visit our WPF grids comparison.
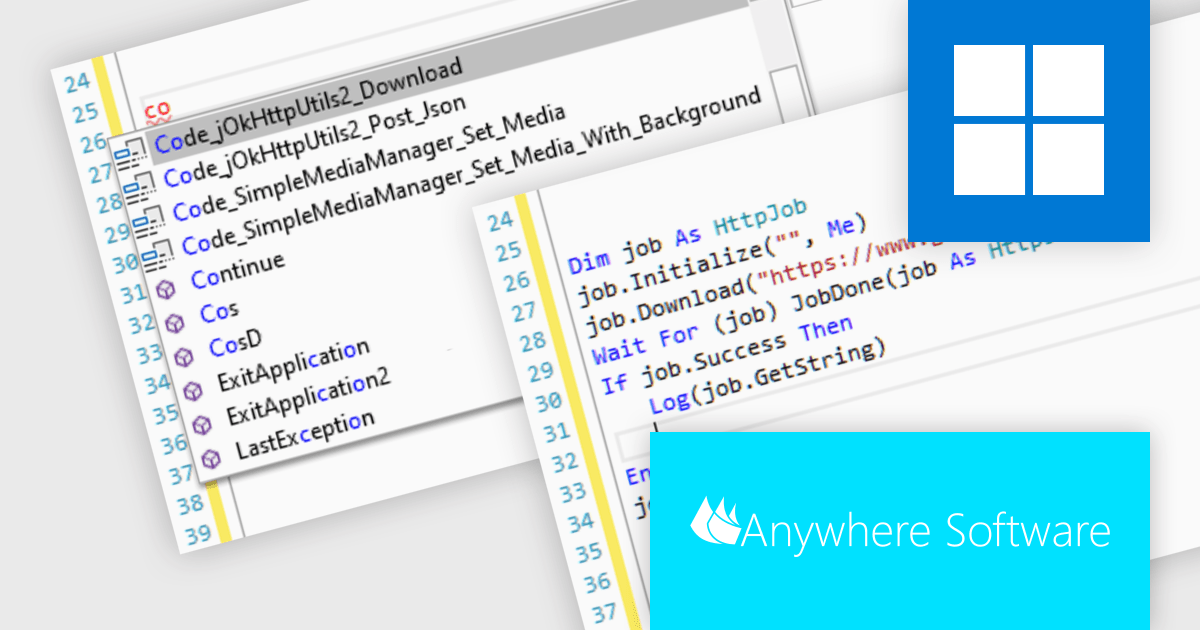
B4i (iOS), by Anywhere Software, is a Rapid Application Development (RAD) tool for building native iOS apps on Windows machines. It shares similar concepts with B4A (Android development), enabling code reuse and cross-platform capabilities. Uniquely, B4i bypasses the need for a local Mac computer, allowing developers to create iOS apps entirely within their Windows environment if they use Anywhere Software's Hosted Mac Builder service to execute the compilation process. B4i offers a powerful solution for Windows developers wanting to tap into the iOS app market.
B4i (iOS) v8.50 introduces support for code snippets. These pre-built code modules, spanning simple loops to entire functions, significantly improve efficiency and promote code consistency, contributing directly to project timelines and code quality.
To see a full list of what's new in v8.50, see our release notes.
B4i (iOS) is licensed per developer and is available as a perpetual license in Standard Edition (with two months of upgrades) or Enterprise Edition (with two years of upgrades). The Hosted Mac Builder Service must be renewed annually to continue using it. See our B4i (iOS) licensing page for full details.
For more information, see our B4i (iOS) product page.
聯繫電話: (888) 850 9911
傳真: +1 770 250 6199


