


官方供應商
我們作為官方授權經銷商,直接提供超過200家開發廠家所發行超過1000個的產品授權給您。
請參閱我們所有的品牌。
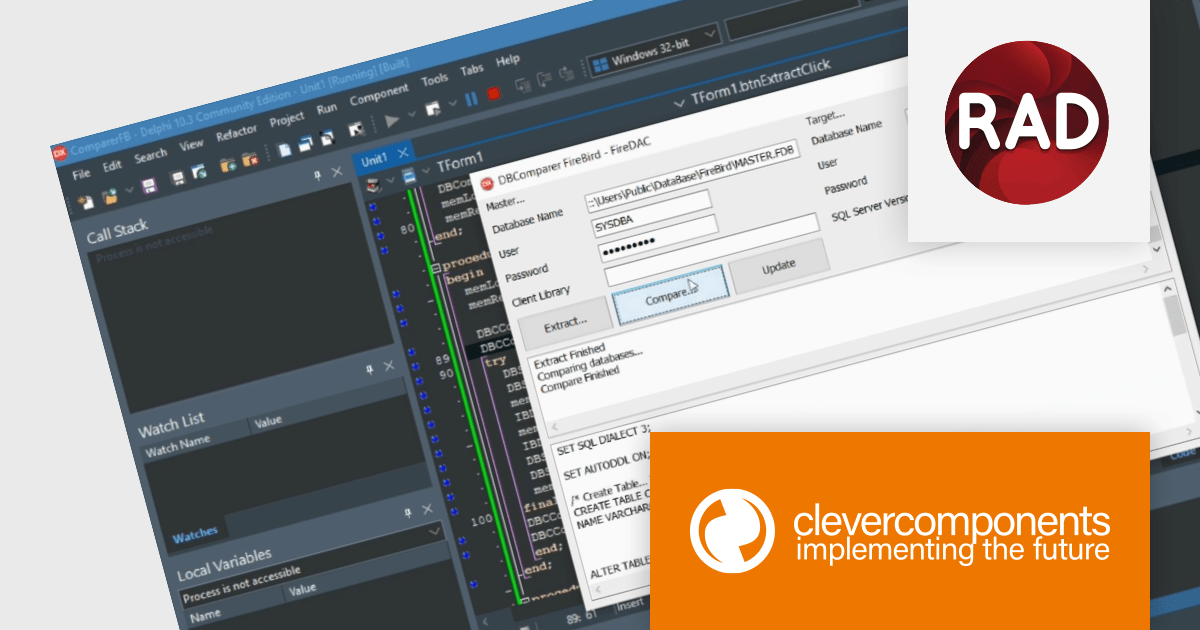
Database Comparer VCL is a library of Delphi and C++Builder components that efficiently compare and synchronize database structures and data across various popular databases like MySQL, SQL Server, and Oracle. It lets you visualize differences, generate synchronization scripts, and update target databases, offering developers a powerful tool for database version control, deployment, and data migration.
Database Comparer VCL for Delphi, C++Builder V8.1.931.0 adds RAD Studio 12 Athens compatibility. It leverages Athens' modernized VCL with high DPI and styling enhancements for richer comparison UIs, utilizes the powerful FireDAC Query by Example for intuitive data filtering, and seamlessly integrates with Embarcadero's GetIt Package Manager for convenient updates, enhancing database comparison and synchronization workflows within the latest development environment.
To see a full list of what's new in V8.1.931.0, see our release notes.
Database Comparer VCL for Delphi, C++Builder is licensed per developer and is available as a perpetual license with one year of updates. Update licenses are available to extend the update period for a further year. See our Database Comparer VCL for Delphi, C++Builder licensing page for full details.
Database Comparer VCL for Delphi, C++Builder is available to buy in the following products:
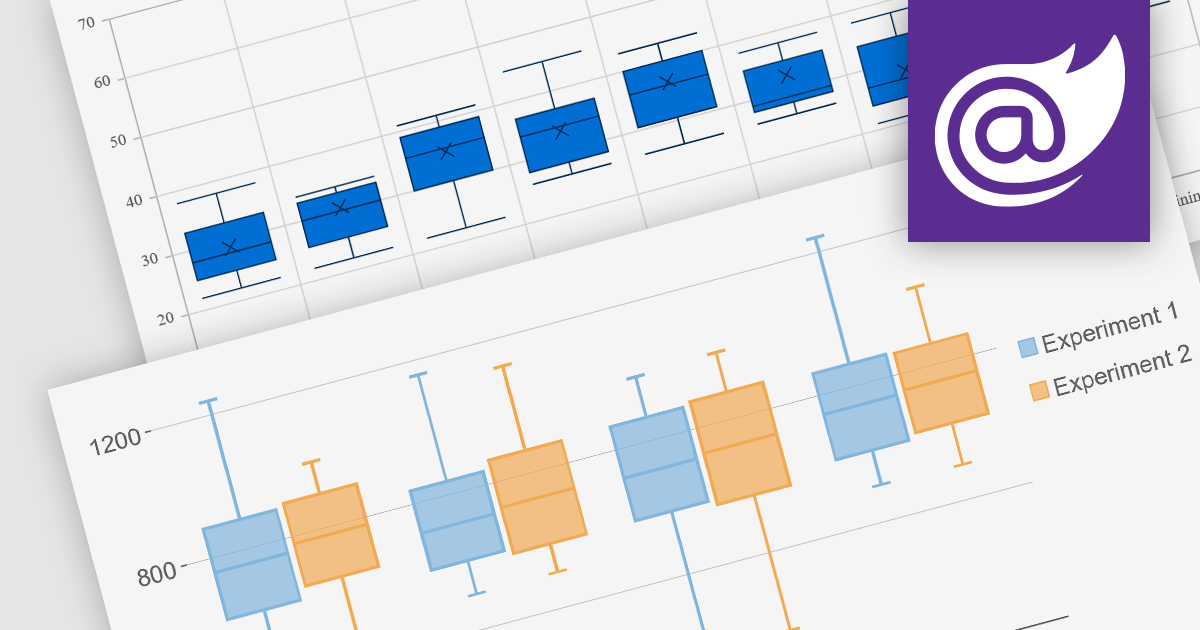
Box plots, also known as box-and-whisker plots, are used to display the distribution of a dataset. They show the median, quartiles, and extremes of the data, providing a quick visual summary of the data's central tendency and variability. This makes them particularly useful for statistical analysis and comparing data across categories.
Several Blazor chart controls offer Box plots including:
For an in-depth analysis of features and price, visit our Blazor chart controls comparison.

ComPDFKit PDF SDK is a robust library empowering developers to build versatile PDF functionality into their applications. It handles viewing, annotating, editing, converting, filling, signing, and securing PDFs with ease, all through a well-documented API and customizable UI source code. This comprehensive SDK saves developers time and resources, accelerating the development of applications with rich, user-friendly PDF features.
The ComPDFKit PDF SDK v1.12.0 release streamlines document editing with a powerful new find and replace function within the content editor. This intuitive tool, equipped with options for case sensitivity, whole word matching, and batch replacement, dramatically enhances efficiency, particularly for large documents. As a result, your PDF-centric applications will see a significant boost in user experience.
To see a full list of what's new in v1.12.0, see our release notes.
ComPDFKit PDF SDK is licensed per application and is available as an annual license with 1 year of support and updates. See our ComPDFKit PDF SDK licensing page for full details.
ComPDFKit PDF SDK is available to buy in the following products:
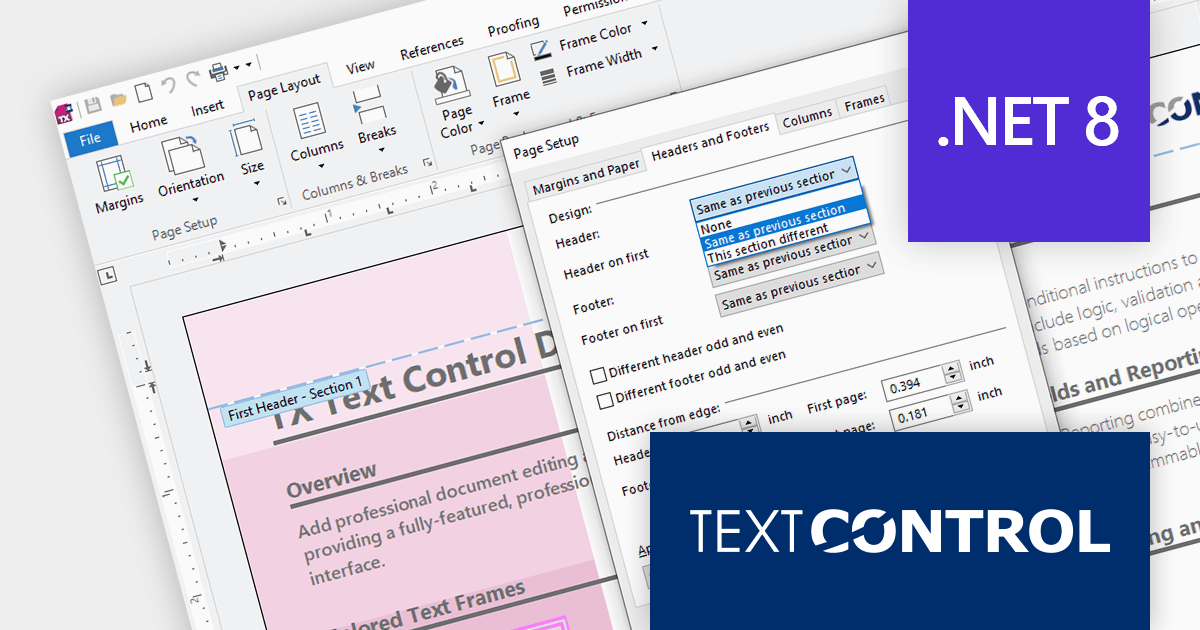
TX Text Control .NET is a royalty-free, fully programmable document editor that empowers developers to add rich WYSIWYG word processing to desktop and web applications across various platforms. It provides everything from comprehensive text formatting and mail merge to PDF creation and processing, all through a robust API and intuitive user interface.
The TX Text Control .NET for Windows Forms and WPF Version 32.0 Service Pack 2 adds support for .NET 8, allowing developers to build word processing applications with the new version of Microsoft's popular framework. Text Control's benchmark tests demonstrate .NET 8's clear advantage over .NET 6 in terms of resource utilization and document processing speed.
To see a full list of what's new in version 32.0 Service Pack 2, see our release notes:
TX Text Control .NET for Windows Forms and TX Text Control .NET for WPF are licensed per developer and are available as a Perpetual License with a 12 month support and maintenance subscription. Subscription renewals are also available. See our TX Text Control .NET for Windows Forms licensing page or TX Text Control .NET for WPF licensing page for full details.
For more information, visit our product pages:

Devart dotConnect is a range of high-performance ADO.NET data providers for various databases and cloud applications, enabling efficient data connectivity for building web and mobile applications. It provides high-performance connectors for databases such as SQL Server and Oracle, as well as Cloud services such as Salesforce and QuickBooks.
The latest releases add support for .NET 8. This allows developers to benefit from the performance improvements, cross-platform compatibility, and new APIs in the latest version of Microsoft's leading development framework.
The dotConnect ADO.NET Data Providers are licensed per developer and are available as a Perpetual License with a 12 month support and maintenance subscription. See our dotConnect licensing pages for BigCommerce, DB2, Dynamics 365, FreshBooks, Magento, Mailchimp, MySQL, Oracle, PostgreSQL, QuickBooks, Salesforce, Salesforce Marketing Cloud, SQL Server, SQLite, SugarCRM, Zoho CRM, and Universal.
For more information about the dotConnect ADO.NET Data Providers visit our product pages:
聯繫電話: (888) 850 9911
傳真: +1 770 250 6199


