


官方供應商
我們作為官方授權經銷商,直接提供超過200家開發廠家所發行超過1000個的產品授權給您。
請參閱我們所有的品牌。
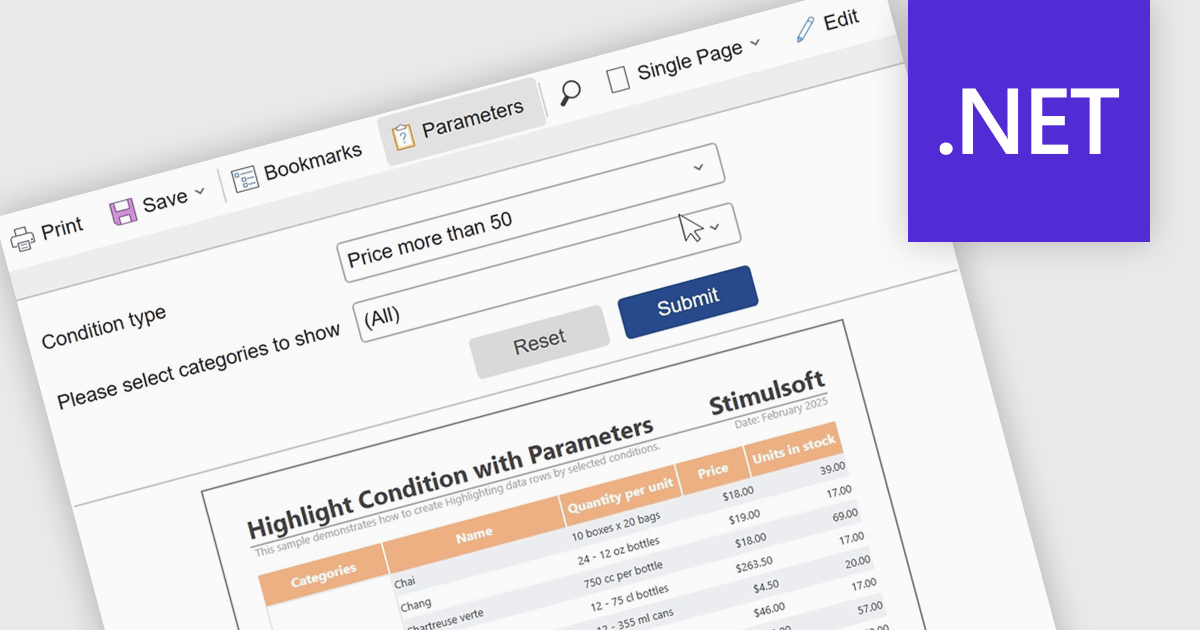
Report parameters allow users to customize and control how data is displayed by filtering results or supplying specific values at runtime. This enables more personalized, relevant reporting without the need to create multiple versions of the same report. By using parameters, organizations can improve data accuracy, improve report management, and help users to explore insights independently. Common use cases include filtering reports by date range, region, department, or product, setting thresholds or targets for performance analysis, and dynamically updating dashboards based on user-selected criteria.
Several .NET reporting components include support for parameters:
For an in-depth analysis of features and price, visit our comparison of .NET reporting controls.
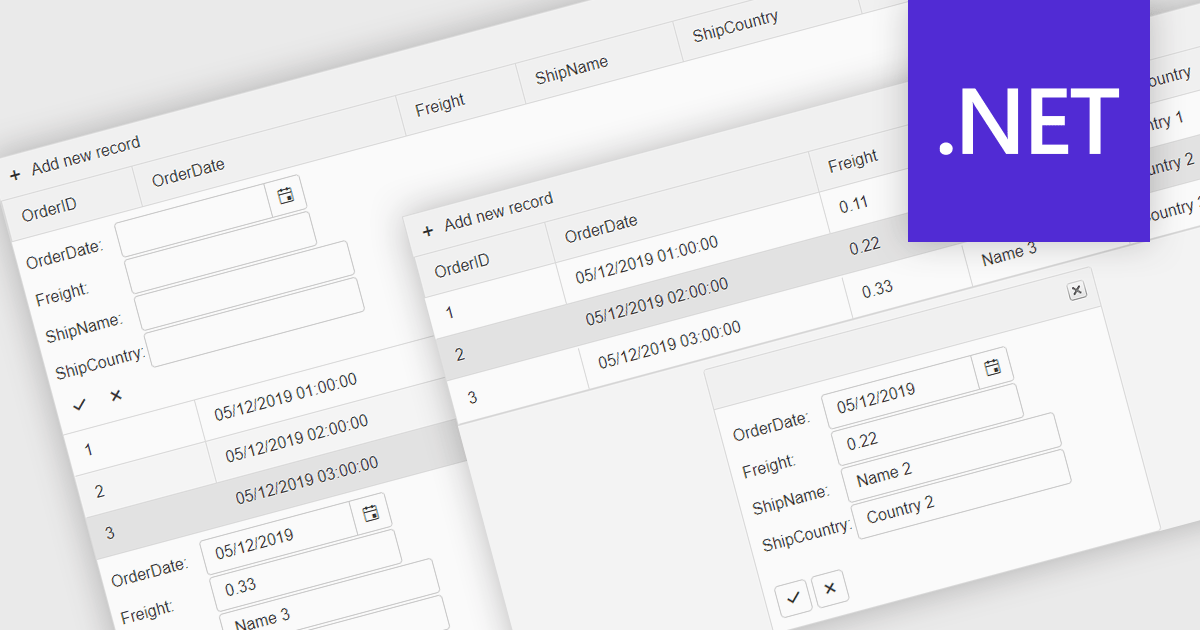
Forms in grids combine tabular data display with built-in form editing, allowing users to view and update records directly within the grid instead of switching to separate edit screens. This approach improves efficiency by keeping users in context, reducing navigation, and providing immediate validation and feedback. Forms in grids are commonly used in administrative dashboards, configuration screens, and data-heavy business applications where users need to edit multiple records quickly while maintaining visibility of related data.
Several .NET grid components enable form-based editing within grids, including:
For an in-depth analysis of features and price, visit our .NET grid controls comparison.
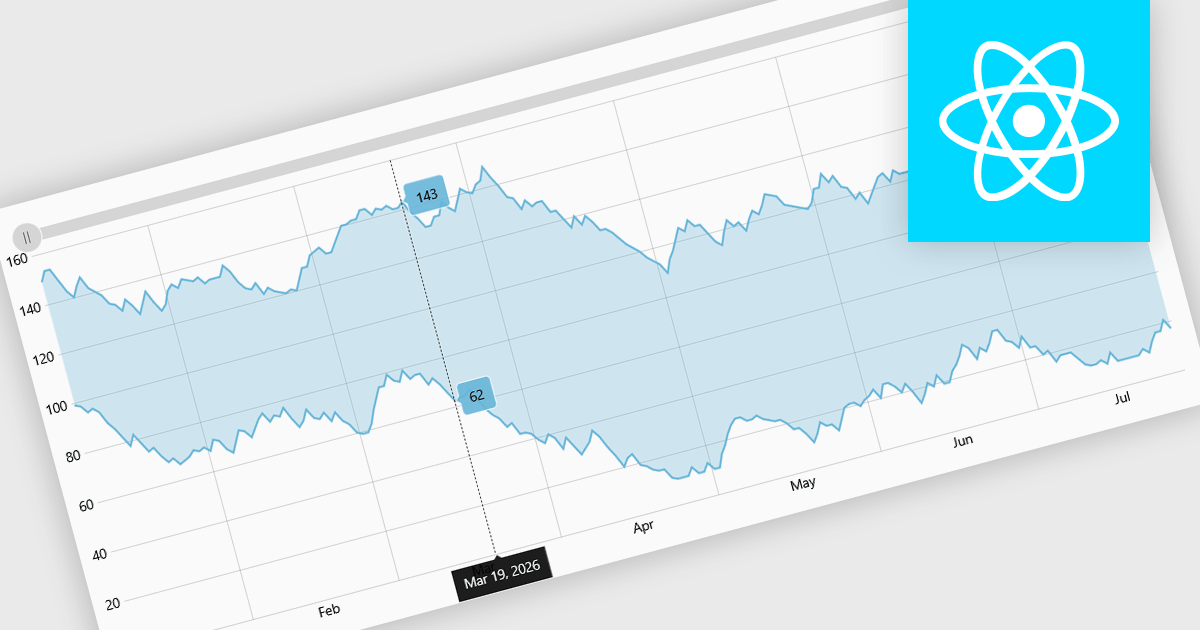
Range charts visualize financial data based on fixed price movements rather than time intervals, grouping activity into consistent ranges to highlight meaningful price action. By filtering out minor fluctuations and market noise, they make trends, volatility, support, and resistance levels easier to identify, especially in fast-moving or irregular markets. Common use cases include technical analysis for trading platforms, monitoring price volatility in equities or cryptocurrencies, and analyzing high-frequency financial data where understanding true market behavior is more important than tracking time-based changes.
Several React charting components provide you with range charts, including:
For an in-depth analysis of features and price, visit our React chart controls comparison.
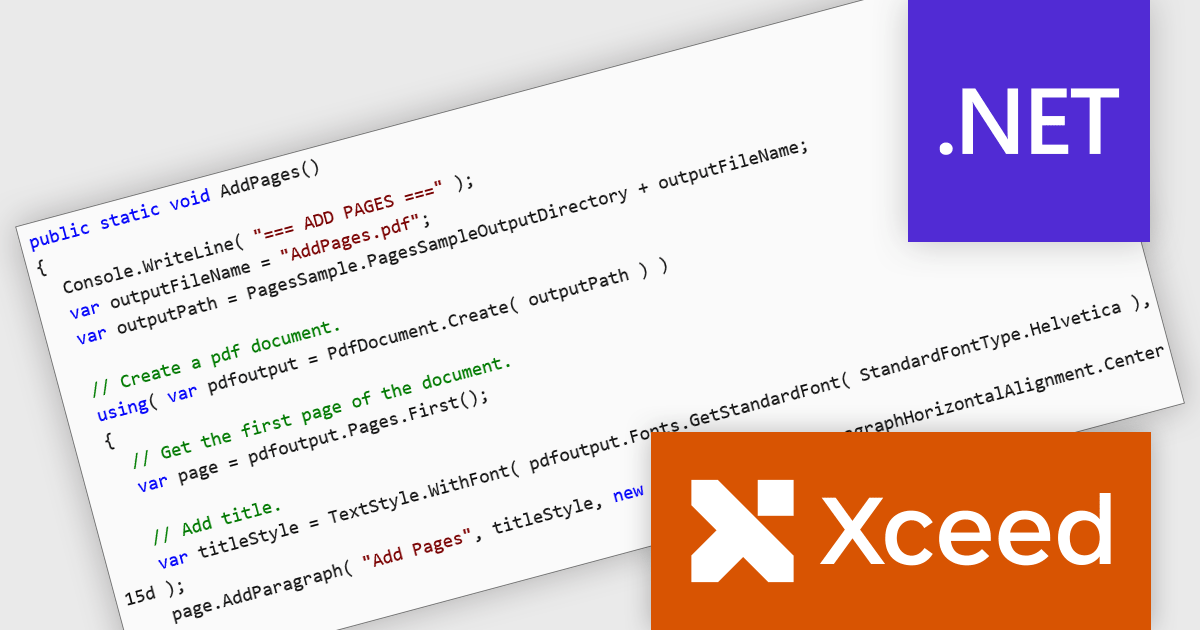
Xceed PDF Library for .NET by Xceed Software is a developer-focused component that enables interaction with PDF documents directly within .NET applications. It provides a clean, intuitive API for creating, editing, and processing PDFs, allowing users to add, modify, or extract content such as text and images without relying on external tools or dependencies.
Designed for reliability and ease of integration, the library supports key features including digital signatures, document encryption, and permission controls to help secure sensitive information. These capabilities make it well suited for a wide range of use cases, from automating document generation and updating existing PDFs to applying security policies and extracting data for reporting or archiving. Ideal for both desktop and server-side applications, Xceed PDF Library for .NET helps teams improve PDF processes while maintaining control and consistency.
Xceed PDF Library for .NET is licensed per developer and is available as a perpetual license with 1 year of updates and support. See our Xceed PDF Library for .NET licensing page for full details.
For more information, visit our Xceed PDF Library for .NET product page.
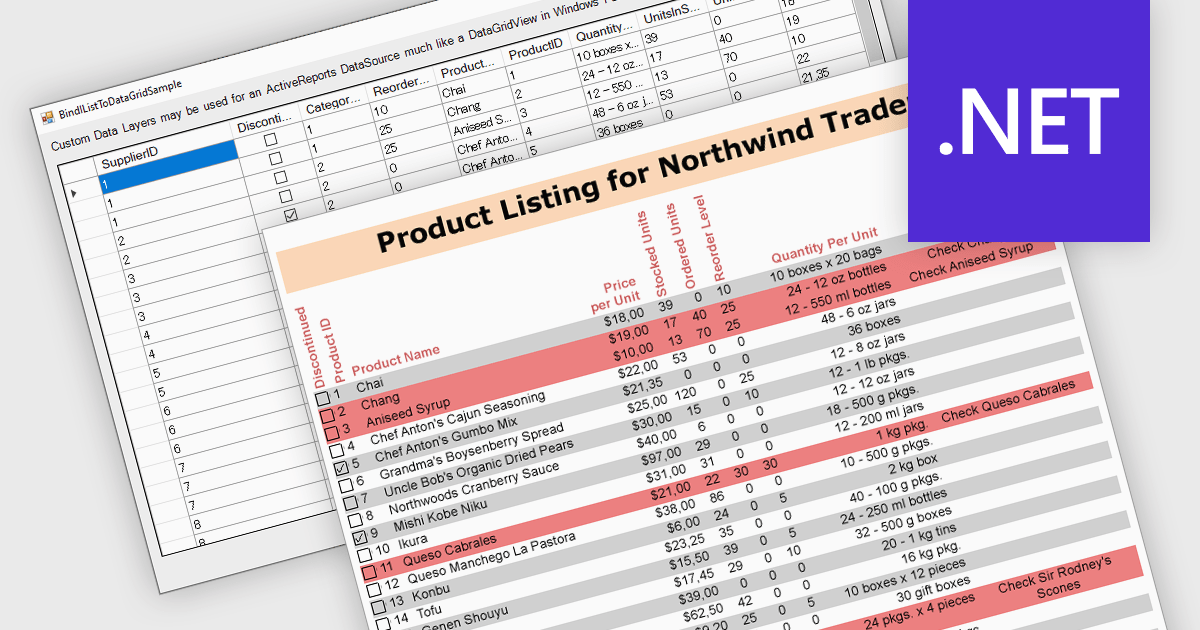
IList data source support in .NET Reporting components allows developers to bind reports directly to in-memory collections that implement the IList interface, such as generic lists or arrays. This capability offers flexibility for working with dynamically generated data or data not stored in a traditional database, making it easier to integrate with object-oriented models. It reduces the need for intermediary storage, supports runtime data manipulation, and is particularly effective in applications where data is constructed or retrieved at runtime through APIs rather than direct database access.
Several .NET Reporting controls offer IList data connectivity including:
For an in-depth analysis of features and price, visit our comparison of .NET Reporting controls.
聯繫電話: (888) 850 9911
傳真: +1 770 250 6199


