
FusionMaps XT
有效地使用交互式地圖顯示類似收入(按區域)之類的地理資料、選舉結果和辦公地點。
由以下開發商製作:FusionCharts
ComponentSource 開始代理銷售的日期:2020年
價格從: US$ 77.42
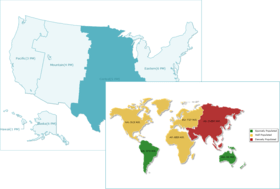
有效地使用交互式地圖顯示類似收入(按區域)之類的地理資料、選舉結果和辦公地點。
由以下開發商製作:FusionCharts
ComponentSource 開始代理銷售的日期:2020年
價格從: US$ 77.42

Please note that FusionMaps new licenses are available as part of FusionCharts Suite
FusionCharts Suite is available as an Annual and Perpetual licenses.
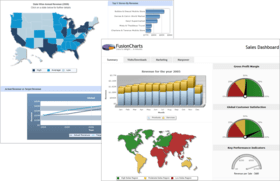
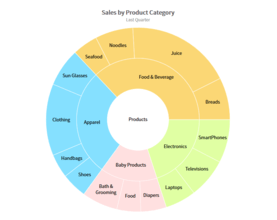
FusionMaps XT helps you display geographical data distributed by category, regions or entities using JavaScript (HTML5). You can use it to plot business data like revenue by regions, census data like population by state, election results, flight routes, office locations and survey results effectively. FusionMaps XT offers over 965 maps including all continents, major countries and all US states. The maps are driven by XML data source and you can integrate them with any web technology (ASP.NET, PHP, Python, Java, Ruby on Rails etc.) and database. You can set up a map in a couple of minutes and then extensively customize them using the XML/JSON API they expose. FusionMaps XT also comes with a visual map builder that helps you enter data and set all configurations of the map. FusionMaps XT is a part of the FusionCharts Suite XT, but functions independently of the other products in the suite as well.


圖像1/11
Advantages of Using FusionMaps XT:

FusionMaps XT 也以___提供︰
Live Chat現在與我們的FusionCharts 專家即時聊天詢問。


聯繫電話: (888) 850 9911
傳真: +1 770 250 6199


