
Infragistics Ignite UI for React
高效能資料網格和大容量資料圖表。
由以下開發商製作:Infragistics
ComponentSource 開始代理銷售的日期:1996年
高效能資料網格和大容量資料圖表。
由以下開發商製作:Infragistics
ComponentSource 開始代理銷售的日期:1996年

Please note that new licenses for Infragistics Ignite UI for React are now only available as part of Infragistics Ignite UI. Existing Infragistics Ignite UI for React customers can continue to renew their current subscription.
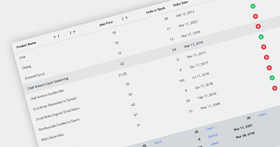
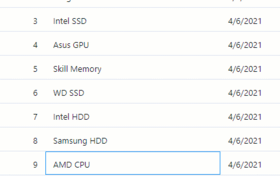
Infragistics Ignite UI for React includes a lightweight React data grid and real-time, high-volume data charts The lightweight data grid was built to meet the challenge of displaying large amounts of data while providing superior versatility and performance on mobile devices. The data charts help you build expressive dashboards, apply deep analytics, and render millions of data points in real-time React charts.


圖像1/11
Infragistics Ignite UI for React includes the following components:
Charts
Layout
Editors
Grids and Lists
FrameWorks
Maps
Data Visualizations
Gauges


Infragistics Ignite UI for React 也以___提供︰
Live Chat現在與我們的Infragistics 專家即時聊天詢問。


聯繫電話: (888) 850 9911
傳真: +1 770 250 6199


